Atlas of Science: Envisioning Scholarly Data
advertisement
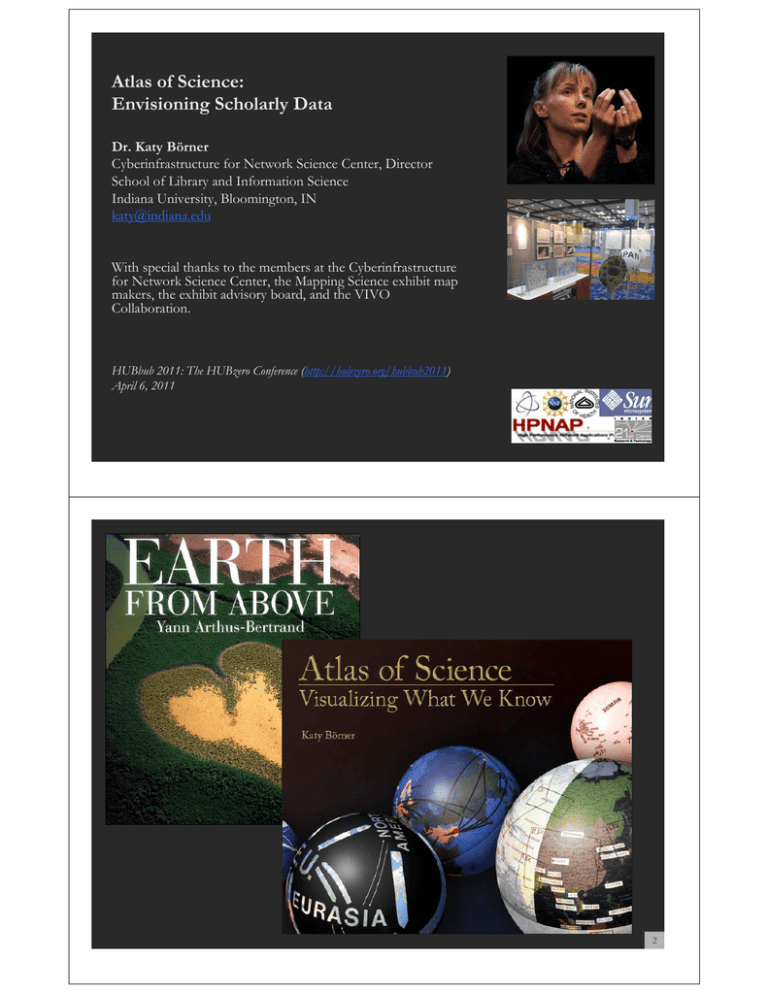
Atlas of Science: Envisioning Scholarly Data Dr. Katy Börner Cyberinfrastructure for Network Science Center, Director School of Library and Information Science Indiana University, Bloomington, IN katy@indiana.edu With special thanks to the members at the Cyberinfrastructure for Network Science Center, the Mapping Science exhibit map makers, the exhibit advisory board, and the VIVO Collaboration. HUBbub 2011: The HUBzero Conference (http://hubzero.org/hubbub2011) April 6, 2011 2 Find your way Black Box Find collaborators, friends Take terra bytes of data Identify trends Early Maps of the World VERSUS 3D Physically-based Accuracy is measurable Trade-offs have more to do with granularity 2-D projections are very accurate at local levels Centuries of experience Geo-maps can be a template for other data 3 Early Maps of Science n-D Abstract space Accuracy is difficult Trade-offs indirectly affect accuracy 2-D projections neglect a great deal of data Decades of experience Science maps can be a template for other data Kevin W. Boyack, UCGIS Summer Meeting, June, 2009 4 Mapping Science Exhibit – 10 Iterations in 10 years http://scimaps.org The Power of Maps (2005) Science Maps for Economic Decision Makers (2008) The Power of Reference Systems (2006) Science Maps for Science Policy Makers (2009) The Power of Forecasts (2007) Science Maps for Scholars (2010) Science Maps as Visual Interfaces to Digital Libraries (2011) Science Maps for Kids (2012) Science Forecasts (2013) How to Lie with Science Maps (2014) Exhibit has been shown in 72 venues on four continents. Currently at - NSF, 10th Floor, 4201 Wilson Boulevard, Arlington, VA - Center of Advanced European Studies and Research, Bonn, Germany - University of Michigan, Ann Arbor, MI 5 Today used as a science “base map”, see later slides Richard Klavans & Kevin W. Boyack. 2007. Maps of Science: Forecasting Large Trends in Science 8 Council for Chemical Research. 2009. Chemical R&D Powers the U.S. Innovation Engine. Washington, DC. Courtesy of the Council for Chemical Research. 10 11 Bollen, Johan, Herbert Van de Sompel, Aric Hagberg, Luis M.A. Bettencourt, Ryan Chute, Marko A. Rodriquez, Lyudmila Balakireva. 2008. A Clickstream Map of Science. 12 Debut of 5th Iteration of the Mapping Science Exhibit at MEDIA X was in 2009 at Wallenberg Hall, Stanford University, http://mediax.stanford.edu, http://scaleindependentthought.typepad.com/photos/scimaps 13 Science Maps in “Expedition Zukunft” science train visiting 62 cities in 7 months, 12 coaches, 300 m long. http://www.expedition-zukunft.de 15 Interactive S&T Maps http://scholarometer.indiana.edu http://mapofscience.com and SciVal by Elsevier Interactive Maps of Science – Philanthropy http://www.philanthropyinsight.org Interactive World and Science Map of S&T Jobs Angela Zoss, Michael Connover, Katy Börner (2010) 20 http://mapsustain.cns.iu.edu 21 Google Map JavaScript API was used to implement both maps with two aggregation layers for each. The geographic map aggregates to the state level and the city level. The science map has a high level of aggregation of 13 top-level scientific disciplines and a low level of 554 sub-disciplines. 22 The geographic map at state level. 23 The geographic map at city level. 24 Search result for “corn” Icons have same size but represent different #records 25 Click on one icon to display all records of one type. Here publications in the state of Florida. 26 Detailed information on demand via original source site for exploration and study. 27 Search result for “Miscanthus,” a special energy biomass crops for second generation biofuel. 28 The science map at 13 top-level scientific disciplines level. 29 The science map at 554 sub-disciplines level. 30 31 32 https://app.nihmaps.org 33 https://app.nihmaps.org https://app.nihmaps.org 35 https://app.nihmaps.org 36 https://app.nihmaps.org 37 http://rd-dashboard.nitrd.gov/pub.html 38 39 S&T Studies Using Semantic Web Data 40 Linked Open Data Interlinking existing data silos and Exposing them as structured data Adding new high quality data relevant for S&T studies http://linkeddata.org August 2007 41 http://www4.wiwiss.fu-berlin.de/bizer/pub/lod-datasets_2009-03-05_colored.png 42 43 VIVO: A Semantic Approach to Creating a National Network of Researchers (http://vivoweb.org) • Semantic web application and ontology editor originally developed at Cornell U. • Integrates research and scholarship info from systems of record across institution(s). • Facilitates research discovery and crossdisciplinary collaboration. • Simplify reporting tasks, e.g., generate biosketch, department report. Funded by $12 million NIH award. Cornell University: Dean Krafft (Cornell PI), Manolo Bevia, Jim Blake, Nick Cappadona, Brian Caruso, Jon Corson-Rikert, Elly Cramer, Medha Devare, John Fereira, Brian Lowe, Stella Mitchell, Holly Mistlebauer, Anup Sawant, Christopher Westling, Rebecca Younes. University of Florida: Mike Conlon (VIVO and UF PI), Cecilia Botero, Kerry Britt, Erin Brooks, Amy Buhler, Ellie Bushhousen, Chris Case, Valrie Davis, Nita Ferree, Chris Haines, Rae Jesano, Margeaux Johnson, Sara Kreinest, Yang Li, Paula Markes, Sara Russell Gonzalez, Alexander Rockwell, Nancy Schaefer, Michele R. Tennant, George Hack, Chris Barnes, Narayan Raum, Brenda Stevens, Alicia Turner, Stephen Williams. Indiana University: Katy Borner (IU PI), William Barnett, Shanshan Chen, Ying Ding, Russell Duhon, Jon Dunn, Micah Linnemeier, Nianli Ma, Robert McDonald, Barbara Ann O'Leary, Mark Price, Yuyin Sun, Alan Walsh, Brian Wheeler, Angela Zoss. Ponce School of Medicine: Richard Noel (Ponce PI), Ricardo Espada, Damaris Torres. The Scripps Research Institute: Gerald Joyce (Scripps PI), Greg Dunlap, Catherine Dunn, Brant Kelley, Paula King, Angela Murrell, Barbara Noble, Cary Thomas, Michaeleen Trimarchi. Washington University, St. Louis: Rakesh Nagarajan (WUSTL PI), Kristi L. Holmes, Sunita B. Koul, Leslie D. McIntosh. Weill Cornell Medical College: Curtis Cole (Weill PI), Paul Albert, Victor Brodsky, Adam Cheriff, Oscar Cruz, Dan Dickinson, Chris Huang, Itay Klaz, Peter Michelini, Grace Migliorisi, John Ruffing, Jason Specland, Tru Tran, Jesse Turner, Vinay Varughese. Type of Analysis vs. Level of Analysis Micro/Individual (1-100 records) Meso/Local (101–10,000 records) Macro/Global (10,000 < records) Statistical Analysis/Profiling Individual person and their expertise profiles Larger labs, centers, universities, research domains, or states All of NSF, all of USA, all of science. Temporal Analysis (When) Funding portfolio of one individual Mapping topic bursts in 20-years of PNAS 113 Years of Physics Research Geospatial Analysis (Where) Career trajectory of one individual Mapping a states intellectual landscape PNAS publications Topical Analysis (What) Base knowledge from which one grant draws. Knowledge flows in Chemistry research VxOrd/Topic maps of NIH funding Network Analysis (With Whom?) NSF Co-PI network of one individual Co-author network NIH’s core competency 47 Temporal Analysis (When) Temporal visualizations of the number of papers/funding award at the institution, school, department, and people level 48 Topical Analysis (What) Science map overlays will show where a person, department, or university publishes most in the world of science. (in work) 49 Network Analysis (With Whom?) Who is co-authoring, co-investigating, co-inventing with whom? What teams are most productive in what projects? 50 http://vivo-netsci.cns.iu.edu 52 53 Data Download Support General Statistics • 36 publication(s) from 2001 to 2010 (.CSV File) • 80 co-author(s) from 2001 to 2010 (.CSV File) Co-Author Network (GraphML File) Save as Image (.PNG file) Tables • Publications per year (.CSV File) • Co-authors (.CSV File) 54 v36 publication(s) from 2001 to 2010 (.CSV File) 80 co-author(s) from 2001 to 2010 (.CSV File) Co-author network (GraphML File) Save as Image (.PNG file) Publications per year (.CSV File), see top file. Co-authors (.CSV File) 55 Run Science of Science (Sci2) Tool and load Co-Author Network (GraphML File) Network Analysis Toolkit Nodes: 81 Edges: 390 Visualize the file using Radial Graph layout. Click on node to focus on it. Hover over a node to highlight its co-authors. Code and tutorials are linked from http://sci.slis.indiana.edu/sci2 56 Video and paper at http://www.scivee.tv/node/27704 Computational Scientometrics Cyberinfrastructures Scholarly Database: 25 million scholarly records http://sdb.slis.indiana.edu VIVO Research Networking http://vivoweb.org Network Workbench Tool & Community Wiki http://nwb.cns.iu.edu Science of Science (Sci2) Tool http://sci2.cns.iu.edu Epidemics Cyberinfrastructure http://epic.cns.iu.edu 57 VIVO National Level Visualizations Future Scripps Scripps WashU VIVO VIVO VIVO UF VIVO Future IU VIVO VIVO Future VIVO Ponce VIVO Prof. Assn. RDF WCMC Triple Store Triple Store VIVO Cornell VIVO RDF Triple Store Search Data Analysis & VisualiVisualization Other RDF Other RDF Regional Triple Store Other RDF Linked Open Data Search 58 02/2010 Science is global. World view of VIVO activity. Web site visits are aggregated at the country level. Geospatial Analysis (Where) Where is what science performed by whom? Science is global and needs to be studied globally. (in work) 59 04/2010 Shown are the - Number of people profiles in the 7 different VIVO installation sites plus CAS and U Melbourne. - Email contacts by data and service providers as well as institutions interested to adopt VIVO. - The number of visitors on http://vivoweb.org Circles are area size coded using a logarithmic scale. 60 06/2010 VIVO 1.0 source code was publicly released on April 14, 2010 87 downloads by June 11, 2010. The more institutions adopt VIVO, the more high quality data will be available to understand, navigate, manage, utilize, and communicate progress in science and technology. 61 http://vivoexperts.ctsi.ufl.edu Second Annual VIVO Conference August 24-26, 2011 Gaylord National, Washington D.C. http://vivoweb.org/conference VIVO is supported by NIH Award U24 RR029822 References Börner, Katy, Chen, Chaomei, and Boyack, Kevin. (2003). Visualizing Knowledge Domains. In Blaise Cronin (Ed.), ARIST, Medford, NJ: Information Today, Volume 37, Chapter 5, pp. 179-255. http://ivl.slis.indiana.edu/km/pub/2003-borner-arist.pdf Shiffrin, Richard M. and Börner, Katy (Eds.) (2004). Mapping Knowledge Domains. Proceedings of the National Academy of Sciences of the United States of America, 101(Suppl_1). http://www.pnas.org/content/vol101/suppl_1/ Börner, Katy, Sanyal, Soma and Vespignani, Alessandro (2007). Network Science. In Blaise Cronin (Ed.), ARIST, Information Today, Inc., Volume 41, Chapter 12, pp. 537607. http://ivl.slis.indiana.edu/km/pub/2007-borner-arist.pdf Börner, Katy (2010) Atlas of Science. MIT Press. http://scimaps.org/atlas Scharnhorst, Andrea, Börner, Katy, van den Besselaar, Peter (2011) Models of Science Dynamics. Springer Verlag. 64 All papers, maps, tools, talks, press are linked from http://cns.iu.edu CNS Facebook: http://www.facebook.com/pages/Cyberinfrastructure-forNetwork-Science-Center/144339535612571 Exhibit Facebook: http://www.facebook.com/mappingscience 65
