Produce Local, Sell Local, Buy Local
advertisement
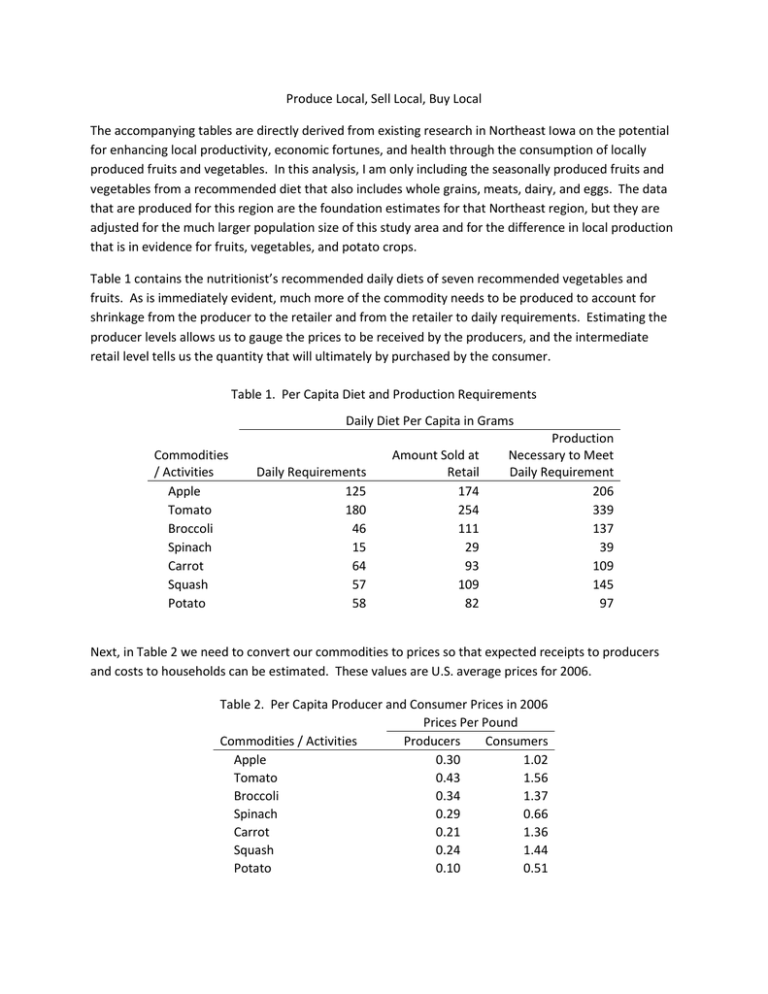
Produce Local, Sell Local, Buy Local The accompanying tables are directly derived from existing research in Northeast Iowa on the potential for enhancing local productivity, economic fortunes, and health through the consumption of locally produced fruits and vegetables. In this analysis, I am only including the seasonally produced fruits and vegetables from a recommended diet that also includes whole grains, meats, dairy, and eggs. The data that are produced for this region are the foundation estimates for that Northeast region, but they are adjusted for the much larger population size of this study area and for the difference in local production that is in evidence for fruits, vegetables, and potato crops. Table 1 contains the nutritionist’s recommended daily diets of seven recommended vegetables and fruits. As is immediately evident, much more of the commodity needs to be produced to account for shrinkage from the producer to the retailer and from the retailer to daily requirements. Estimating the producer levels allows us to gauge the prices to be received by the producers, and the intermediate retail level tells us the quantity that will ultimately by purchased by the consumer. Table 1. Per Capita Diet and Production Requirements Daily Diet Per Capita in Grams Commodities / Activities Apple Tomato Broccoli Spinach Carrot Squash Potato Daily Requirements 125 180 46 15 64 57 58 Amount Sold at Retail 174 254 111 29 93 109 82 Production Necessary to Meet Daily Requirement 206 339 137 39 109 145 97 Next, in Table 2 we need to convert our commodities to prices so that expected receipts to producers and costs to households can be estimated. These values are U.S. average prices for 2006. Table 2. Per Capita Producer and Consumer Prices in 2006 Prices Per Pound Commodities / Activities Producers Consumers Apple 0.30 1.02 Tomato 0.43 1.56 Broccoli 0.34 1.37 Spinach 0.29 0.66 Carrot 0.21 1.36 Squash 0.24 1.44 Potato 0.10 0.51 Table 3 gives us the total annual values in terms of production and as costs to households for this increment to area diets. At the farm gate, the diet is worth, annually, $71.8 million. At the household level, it costs $226.7 million Table 3. Annual Values: Producer Returns and Consumer Prices Total Prices Received or Paid Commodities Apple Tomato Broccoli Spinach Carrot Squash Potato Producers Consumers 13,080,998 31,156,581 9,801,339 2,396,133 4,743,502 7,456,010 2,164,150 $70,798,714 37,572,813 83,860,278 32,352,683 4,014,768 26,764,912 33,183,719 8,933,969 $226,683,142 As the commodities above cannot be produced year round, we have to temper our production to our region. We can assume that 25 percent of our annual need of these commodities can be produced in the region – three months’ worth of consumption. Table 4 gives an estimate of the total land needed to produce these fruits and vegetables for local consumers based on average yields in Iowa. Over 4,300 acres would be required to produce the commodities. Table 4. Seasonal Commodities Land Requirements Commodities Apple Tomato Broccoli Spinach Carrot Squash Potato Total Crop 25 Percent 1,090 654 727 292 196 1,132 234 4,326 The total value of production is contained in Table 5. This will be the amount of industrial output that is inserted into the impact model to measure the producer level gross economic values. Table 5. Seasonal Crop Production Revenues Commodities / Activities Apple Tomato Broccoli Spinach Carrot Squash Potato Total Crop 25 Percent 3,270,250 7,789,145 2,450,335 599,033 1,185,876 1,864,003 541,038 $17,699,679 Next, in Table 6, we get the amount of existing production in the region of all fruits and vegetables. When we calculate the overall economic values, we need to account for existing production. Table 6. Estimated Current Production Acres 896 211 12 Vegetable Orchard Potatoes Percent of Demand Met by Existing Production 30% 19% 5% Table 7 is the estimate of the regional economic value of producing 25 percent of the fruits and vegetables of this diet locally. In producing nearly $17.7 million in output, regional farmers will require 136 jobs (including the farmers) and generate an anticipated $5.5 million in labor income. They will support an additional 45 jobs in the supplying sector making $1.02 million in labor income. Those workers and the workers on the farms will convert their earnings into household income and induce an additional $3.24 million in output, which in turn will require 38 more jobs. In total, the production would support 219 area jobs and $7.4 million in labor incomes. Table 7. Seasonal at 25 percent of annual demand Output Value Added Labor Income Jobs Direct Indirect Induced Total Multiplier 17,699,677 2,724,674 3,236,315 23,660,666 1.34 9,277,021 1,393,602 1,922,153 12,592,776 1.36 5,493,409 1,016,646 904,805 7,414,860 1.35 136 45 38 219 1.61 Next we adjust for existing production to get at the net production level economic values. Considering existing production, we are left with 162 net new jobs regionally. Table 8. Seasonal at 25 percent of annual demand adjusted for existing production Output Value Added Labor Income Jobs Direct 13,121,431 6,877,402 4,072,469 101 Indirect 2,019,903 1,033,129 753,677 33 Induced 2,399,201 1,424,964 670,765 28 Total 17,540,535 9,335,494 5,496,912 162 Multiplier 1.34 1.36 1.35 1.61 Last, as we require land to produce this output, we need to reduce the economic values of traditional soybean and corn farmers as we are assuming that all land in production in the region is spoken for and that new fruits and vegetables acres have to come from existing commodities. The total losses to corn and soybean famers multiplies through regionally to a total reduction of 65 jobs earning $1.85 million. Table 9. Losses to corn and soybean producers from reduced acreage Output Value Added Labor Income Jobs Direct -5,597,068 -2,815,571 -1,403,927 -46 Indirect -593,679 -316,012 -208,169 -9 Induced -828,903 -492,434 -231,658 -10 Total Multiplier -7,019,650 1.25 -3,624,014 1.29 -1,843,757 1.31 -65 1.40 When we difference tables 8 and 9 we get the net increase in agricultural productivity to the region that is linked to the nutritional goal. In all, at the producer level, the region would gain 55 jobs and $2.7 million in labor income. Once multiplied through, that productivity on the farm will support a total of 97 jobs and $3.65 million in labor income. Readers will notice that both the job and labor income multiplier in Table 10 is greater than those in Table 9. This kind of production has stronger linkages, therefore multipliers, with the regional economy than conventional corn and soybean farming. Table 10. Net regional gains considering corn and soybean offsets and existing production Output Value Added Labor Income Jobs Direct 7,524,363 4,061,831 2,668,543 55 Indirect 1,426,224 717,117 545,508 24 Induced 1,570,298 932,530 439,108 18 Total 10,520,885 5,711,481 3,653,155 97 Multiplier 1.40 1.41 1.37 1.78 Next we allow our farmers to become direct sellers of half of their produce. In so doing we fabricate sets of distribution centers across the region where our farmers sell their produce directly to consumers while the remaining half of their produce is distributed via wholesalers to existing grocers. The full value of that production is contained in Table 11. As we are only looking at the increment to productivity of the direct sales, we do not double-count the transfer of the produce to the retailer – instead we look at it as two portions of a continuing transaction where the farmer is already paid for the produce, and the retailers’ margins are calculated net of that transaction. In Table 11, we calculate the expected industrial output that would be associated with the direct sale of the vegetables and fruits to area residents. We estimate that it will take 573 jobs to market this amount of produce for the 4 months of operation allowed for the industry. We recognize that these are temporary, seasonal jobs. In all we estimate that it will link to 664 regional jobs and $10.3 million in labor income. Table 11. Total Economic Effects of Producer / Seller Markets Output Value Added Labor Income Jobs Direct 19,494,673 8,776,202 7,886,443 573 Indirect 3,540,427 1,840,995 1,142,772 40 Induced 4,453,108 2,637,399 1,243,980 51 Total Multiplier 27,488,212 1.41 13,254,599 1.51 10,273,195 1.30 664 1.16 As these jobs and these sales must come at the expense of existing grocers, we have to offset their losses. The retailers do not lose the total sales, they lose the margined value of the sales as the cost of goods sold and all transportation costs are external to their firms. The retail margins were estimated for the quantity of sales lost and are contained in Table 12. It would cost area grocers 175 jobs making $3.14 million in labor income to reduce sales by the amounts in this example. That loss multiplied through the regional economy would cost 207 jobs making just under $4 million in labor income. Table 12. Total Economic Offsets of Existing Grocers' Lost Sales Output Value Added Labor Income Jobs Direct -7,792,232 -4,488,364 -3,139,612 -175 Indirect -1,093,912 -569,161 -353,317 -12 Induced -1,669,350 -991,216 -466,918 -20 Total -10,555,495 -6,048,743 -3,959,847 -207 Multiplier 1.35 1.35 1.26 1.18 When we difference tables 11 and 12, we get the net addition to regional economic activity attributable to the direct sales scenario. The sales outlets would support 398 jobs making $4.75 million. In all, once all of the transactions and input requirements multiplied through the regional economy, 457 jobs and $6.3 million in labor incomes would be supported while the stores were in operation. We have our farmer retailers earning much more than the marginal losses to the retailers for a couple of reasons: first, we have the producer / retailer absorb all transport costs as part of existing operations – all of the produce already had to be hauled, so the implied cost of transportation is zero when compared to the grocers’ cost of goods sold. Last we have used national average prices for produce. Accordingly, the difference between the consumers’ costs and all remaining estimated operation payments have to accumulate to someone: we chose to allocate those values to the proprietors. Table 17. Net Regional Economic Effects of Producer / Seller Markets After Considering Lost Sales To Grocery Stores Output Value Added Labor Income Jobs Direct 11,702,441 5,458,855 4,746,831 398 Indirect 2,446,515 1,271,834 789,455 28 Induced 2,783,758 1,646,184 777,062 32 Total 16,932,717 8,376,873 6,313,348 457 Multiplier 1.45 1.53 1.33 1.15
