Stat 415 – Ecological Ordination – Fall 2011 Homework 2 answers
Stat 415 – Ecological Ordination – Fall 2011
Homework 2 answers
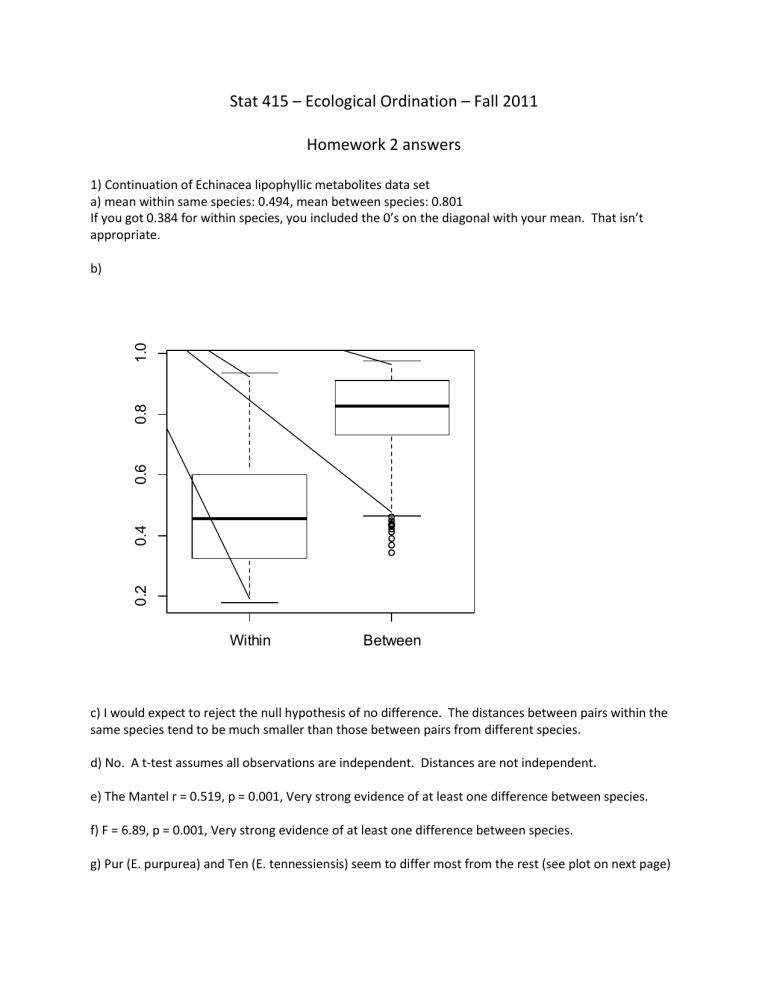
1) Continuation of Echinacea lipophyllic metabolites data set a) mean within same species: 0.494, mean between species: 0.801
If you got 0.384 for within species, you included the 0’s on the diagonal with your mean. That isn’t appropriate. b)
Within Between c) I would expect to reject the null hypothesis of no difference. The distances between pairs within the same species tend to be much smaller than those between pairs from different species. d) No. A t-test assumes all observations are independent. Distances are not independent. e) The Mantel r = 0.519, p = 0.001, Very strong evidence of at least one difference between species. f) F = 6.89, p = 0.001, Very strong evidence of at least one difference between species. g) Pur (E. purpurea) and Ten (E. tennessiensis) seem to differ most from the rest (see plot on next page)
Ang
Ten
Ten
Ten
Ten
Pal Ang
Ang
Ang
Atr
Atr
Atr
Ang
Lae
Lae
Sim
Sim
Par
Par
Pal
Sim
Pal
Pal
Ang
Par
Par
Hyb
Pal
Pur
Pur
Pur
-1.0
-0.5
0.0
0.5
1.0
1.5
NMDS1 h) betadisper(), F = 1.58, p = 0.16
2) Continuation of the Missouri Fish analysis a) F = 2.55, p = 0.005, strong evidence of a difference in species composition between the three sites. b) F = 3.38, p = 0.01, evidence of a difference in species composition between main and chute habitats. c) F = 3.38 (same as before), p = 0.00998 (slightly different). The second analysis uses a different set of permutations.
My R code:
# My R code for HW 2
# Problem 1) more Echinacea lipophyllic metabolite analyses
# code below assumes lipo and lipo.m already created lipo$spp <- substring(lipo$access,1,3) lipo$spp.f <- as.factor(lipo$spp) library(vegan) lipo.canb <- vegdist(lipo.m, method='canb') lipo.canbd <- as.matrix(lipo.canb) lipo.DN <- outer(lipo$spp, lipo$spp, '!=')
# FALSE is same spp, TRUE is diff spp
# zeros on diagonal considered 'same spp', set to missing diag(lipo.DN) <- NA tapply(lipo.canbd,lipo.DN,mean, na.rm=T) boxplot(split(lipo.canbd,lipo.DN), names=c('Within','Between')) title("Canberra distance on Echinceae metabolites") mantel(lipo.canb,lipo.DN) adonis(lipo.canb ~ spp.f, data=lipo) dimnames(lipo.m)[[1]] <- lipo$spp lipo.mds <- metaMDS(lipo.m, 'canb', autotransform=F,expand=F, k=2) plot(lipo.mds, display='sites', type='t') ordihull(lipo.mds, lipo$spp) lipo.bd <- betadisper(lipo.canb,lipo$spp) anova(lipo.bd)
# problem 2: Missouri fish analysis
# code below assumes that fish, fish.m, fishenv, and fish.bray
# alread constructed and variables converted to factors.
# Uses Bray-Curtis distance (not specifically stated in the problem, but that is my default distance) adonis(fish.bray~gear+habitat+site, data=fishenv) adonis(fish.bray~gear+site+habitat, data=fishenv)
