The Nation's Report Card™ Science 2009 Frequently Asked Questions
advertisement
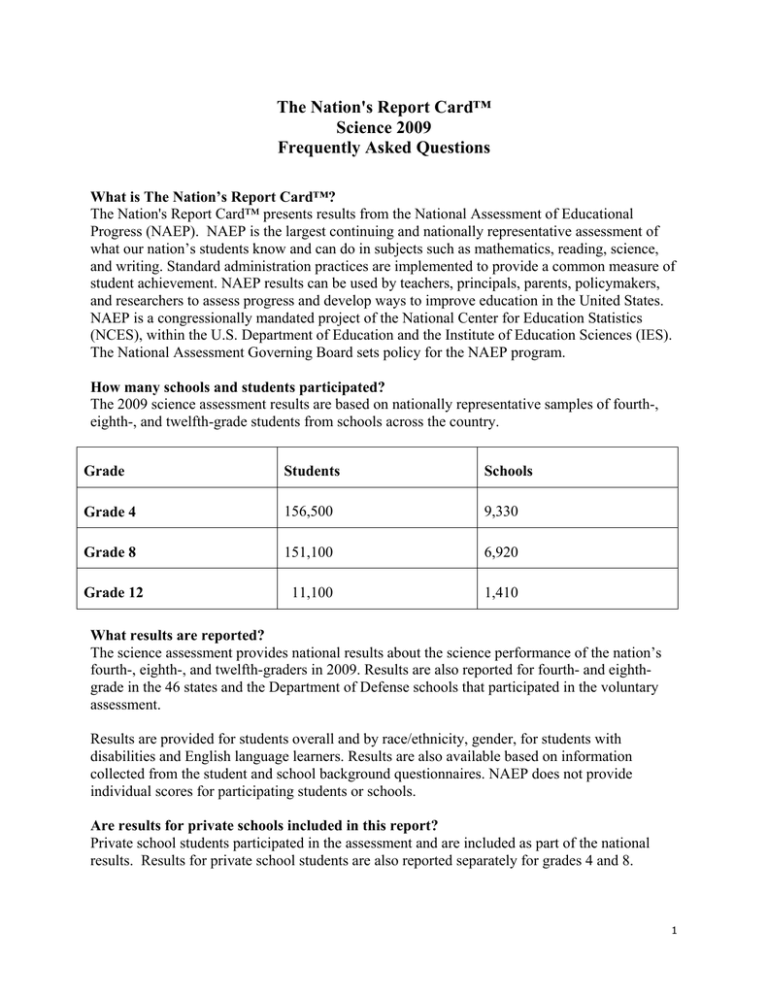
The Nation's Report Card™ Science 2009 Frequently Asked Questions What is The Nation’s Report Card™? The Nation's Report Card™ presents results from the National Assessment of Educational Progress (NAEP). NAEP is the largest continuing and nationally representative assessment of what our nation’s students know and can do in subjects such as mathematics, reading, science, and writing. Standard administration practices are implemented to provide a common measure of student achievement. NAEP results can be used by teachers, principals, parents, policymakers, and researchers to assess progress and develop ways to improve education in the United States. NAEP is a congressionally mandated project of the National Center for Education Statistics (NCES), within the U.S. Department of Education and the Institute of Education Sciences (IES). The National Assessment Governing Board sets policy for the NAEP program. How many schools and students participated? The 2009 science assessment results are based on nationally representative samples of fourth-, eighth-, and twelfth-grade students from schools across the country. Grade Students Schools Grade 4 156,500 9,330 Grade 8 151,100 6,920 Grade 12 11,100 1,410 What results are reported? The science assessment provides national results about the science performance of the nation’s fourth-, eighth-, and twelfth-graders in 2009. Results are also reported for fourth- and eighthgrade in the 46 states and the Department of Defense schools that participated in the voluntary assessment. Results are provided for students overall and by race/ethnicity, gender, for students with disabilities and English language learners. Results are also available based on information collected from the student and school background questionnaires. NAEP does not provide individual scores for participating students or schools. Are results for private schools included in this report? Private school students participated in the assessment and are included as part of the national results. Results for private school students are also reported separately for grades 4 and 8. 1 However, private school participation at grade 12 was too low to report results separately in 2009. What additional results are available for participating states? There are a variety of tools available on the NAEP website at http://nces.ed.gov/nationsreportcard to further explore state results. The NAEP Data Explorer allows users to examine results by student demographic characteristics and by responses to questionnaires completed by students, teachers, and school administrators. The NAEP Questions Tool provides results for each participating state on all released NAEP questions. State profiles provide an overview of each state’s performance in NAEP and how it compares to the national average and to other states, information on state demographics, and links to state snapshot reports. How are results reported? Performance is reported in two ways—as average scale scores and achievement levels. • • Results are reported as average scores on separate scales for each subject. Science scores are reported on a 0-300 point scale. The NAEP achievement levels, which measure performance against a set of standards for what students should know and be able to do, are Basic, Proficient, and Advanced. NAEP results are reported as percentages of students performing at or above these levels. Achievement levels were established by the National Assessment Governing Board. Because NAEP scales and achievement levels are developed independently for each grade and each subject, student performance cannot be compared across grades or subjects. Is it possible to evaluate trends in the science results? A new framework for science was introduced in 2009. It was determined that the results under the new framework could not be compared with those from previous assessments, and a new trend line was started in 2009. How does the new framework differ from those of previous assessment years? The new science framework for the 2009 assessment was developed to keep the assessment content current with key developments in science standards (including the National Science Education Standards and Benchmarks for Science Literacy), assessments, and research. Like the previous framework, the Science Framework for the 2009 National Assessment of Educational Progress organized the assessment content into three areas: physical science, life science, and Earth and space sciences. In contrast to the earlier framework, the 2009 science framework emphasizes four science practices: identifying science principles, using science principles, using scientific inquiry, and using technological design. The practices describe how students use their scientific knowledge by measuring what they are able to do with the science content. The four science practices emphasize the multiple content areas by requiring student knowledge of one or both of the other content areas. 2 In addition, the framework gives greater emphasis to Earth and space sciences at eighth-grade and to life and physical sciences at the twelfth-grade. The complete science framework for the 2009 assessment, including additional information on how it differs from the previous framework, is available on the Web at http://www.nagb.org/publications/frameworks/science09.pdf. What process is used to develop the assessments? Like every NAEP assessment, the science assessment is based on frameworks that are developed by the National Assessment Governing Board. The frameworks reflect the knowledge and experience of subject-area experts, school administrators, policymakers, teachers, parents, and others. NCES is responsible for developing NAEP questions based on framework specifications. The questions are developed in consultation with classroom teachers, curriculum specialists, and test development specialists, and are fieldtested in schools across the country before an actual assessment is given. Frameworks are revised or replaced periodically to reflect new developments in the field and to keep the assessments in line with current instructional practices. What testing accommodations were offered? Accommodations are adaptations to standard testing procedures that remove barriers to participation in assessments without changing what is being tested. NAEP allows students with disabilities and English language learners to use most testing accommodations that they receive in state or district tests. Examples of such accommodations are using bilingual test booklets, in English and Spanish, having the assessment questions read aloud, and taking the assessment in a one-on-one session. In science, allowing extra time and giving the assessment in a small-group format were the two most commonly used accommodations. Can NAEP data and assessment results be used for further exploration of education and policy issues? Because of its large scale, the regularity of its administration, and its thorough quality control process for data collection and analysis, NAEP provides numerous opportunities for data analysis beyond the initial release reports. NAEP data (available on the NAEP website, http://nces.ed.gov/nationsreportcard/naepdata/) are used by researchers, educators, and policymakers. For more information about The Nation’s Report Card, visit http://nationsreportcard.gov. Links to other resources: NCES NAEP Data Explorer NAEP Questions Tool NAEP Frameworks NAEP Achievement Levels http://nces.ed.gov http://nces.ed.gov/nationsreportcard/naepdata/ http://nces.ed.gov/nationsreportcard/itmrlsx/ http://www.nagb.org/publications/frameworks.htm http://www.nagb.org/publications/achievement.htm 3
