STATISTICS 402B Spring 2016 Homework Set#7
advertisement
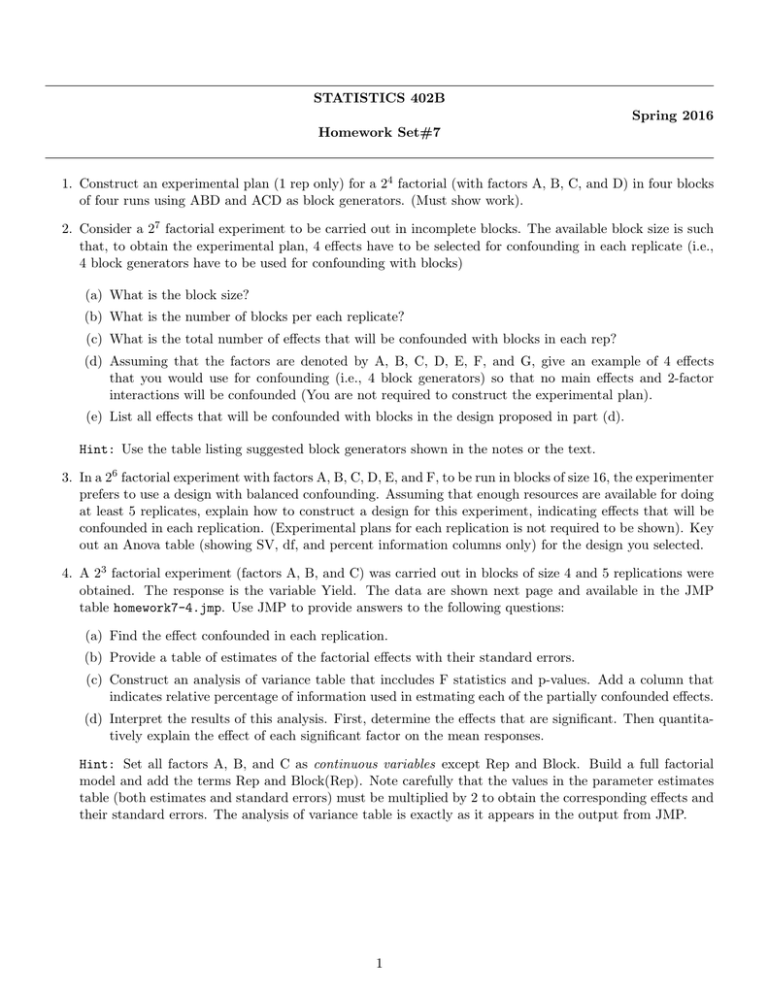
STATISTICS 402B Spring 2016 Homework Set#7 1. Construct an experimental plan (1 rep only) for a 24 factorial (with factors A, B, C, and D) in four blocks of four runs using ABD and ACD as block generators. (Must show work). 2. Consider a 27 factorial experiment to be carried out in incomplete blocks. The available block size is such that, to obtain the experimental plan, 4 effects have to be selected for confounding in each replicate (i.e., 4 block generators have to be used for confounding with blocks) (a) What is the block size? (b) What is the number of blocks per each replicate? (c) What is the total number of effects that will be confounded with blocks in each rep? (d) Assuming that the factors are denoted by A, B, C, D, E, F, and G, give an example of 4 effects that you would use for confounding (i.e., 4 block generators) so that no main effects and 2-factor interactions will be confounded (You are not required to construct the experimental plan). (e) List all effects that will be confounded with blocks in the design proposed in part (d). Hint: Use the table listing suggested block generators shown in the notes or the text. 3. In a 26 factorial experiment with factors A, B, C, D, E, and F, to be run in blocks of size 16, the experimenter prefers to use a design with balanced confounding. Assuming that enough resources are available for doing at least 5 replicates, explain how to construct a design for this experiment, indicating effects that will be confounded in each replication. (Experimental plans for each replication is not required to be shown). Key out an Anova table (showing SV, df, and percent information columns only) for the design you selected. 4. A 23 factorial experiment (factors A, B, and C) was carried out in blocks of size 4 and 5 replications were obtained. The response is the variable Yield. The data are shown next page and available in the JMP table homework7-4.jmp. Use JMP to provide answers to the following questions: (a) Find the effect confounded in each replication. (b) Provide a table of estimates of the factorial effects with their standard errors. (c) Construct an analysis of variance table that inccludes F statistics and p-values. Add a column that indicates relative percentage of information used in estmating each of the partially confounded effects. (d) Interpret the results of this analysis. First, determine the effects that are significant. Then quantitatively explain the effect of each significant factor on the mean responses. Hint: Set all factors A, B, and C as continuous variables except Rep and Block. Build a full factorial model and add the terms Rep and Block(Rep). Note carefully that the values in the parameter estimates table (both estimates and standard errors) must be multiplied by 2 to obtain the corresponding effects and their standard errors. The analysis of variance table is exactly as it appears in the output from JMP. 1 Block 1 Treatment Observation a 8 b 9 c 8 abc 10 Block 2 Treatment Observation Treatment Observation (1) 5 (1) 4 ab 11 b 6 ac 8 ac 7 bc 6 abc 8 Treatment Observation Treatment Observation ab 7 (1) 6 bc 8 ab 11 a 5 abc 9 c 4 c 6 Treatment Observation Treatment Observation a 4 (1) 5 b 6 bc 7 ac 5 ac 8 bc 5 ab 12 Treatment Observation Treatment Observation a 7 a 3 abc 10 bc 4 b 8 abc 7 c 7 (1) 4 Treatment Observation ab 6 ac 9 b 8 c 7 Rep 1 Block 1 Rep 2 Block 2 Block 1 Rep 3 Block 2 Block 1 Rep 4 Block 2 Block 1 Rep 5 Block 2 Note: Need to present written answers to each part, with calculation shown for parts that you are required to do hand computation. Use the JMP output to obtain numbers for answering other parts. Attach edited JMP output when you use the JMP output to extract numbers as part of the analysis. The JMP data file homework7-4.jmp is available to download. Due Friday, April 22nd, 2016 (turn-in at the beginning of class) 2
