18.354/12.207 Spring 2014
advertisement
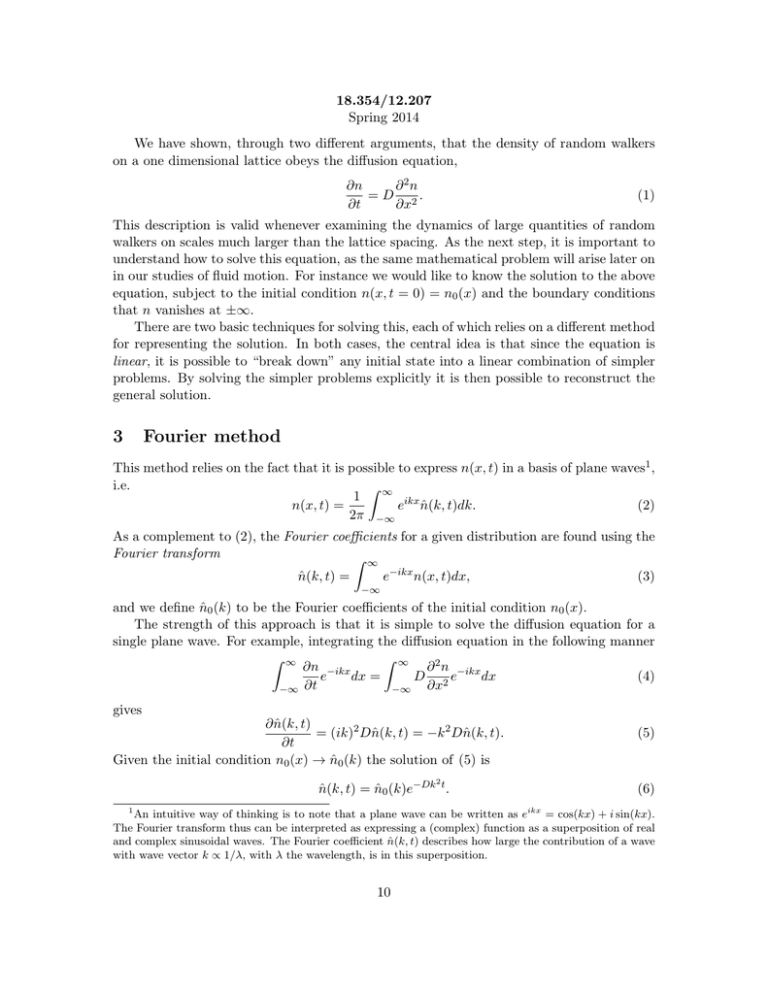
18.354/12.207 Spring 2014 We have shown, through two different arguments, that the density of random walkers on a one dimensional lattice obeys the diffusion equation, ∂n ∂2n = D 2. ∂t ∂x (1) This description is valid whenever examining the dynamics of large quantities of random walkers on scales much larger than the lattice spacing. As the next step, it is important to understand how to solve this equation, as the same mathematical problem will arise later on in our studies of fluid motion. For instance we would like to know the solution to the above equation, subject to the initial condition n(x, t = 0) = n0 (x) and the boundary conditions that n vanishes at ±∞. There are two basic techniques for solving this, each of which relies on a different method for representing the solution. In both cases, the central idea is that since the equation is linear, it is possible to “break down” any initial state into a linear combination of simpler problems. By solving the simpler problems explicitly it is then possible to reconstruct the general solution. 3 Fourier method This method relies on the fact that it is possible to express n(x, t) in a basis of plane waves1 , i.e. Z ∞ 1 n(x, t) = eikx n̂(k, t)dk. (2) 2π −∞ As a complement to (2), the Fourier coefficients for a given distribution are found using the Fourier transform Z ∞ n̂(k, t) = e−ikx n(x, t)dx, (3) −∞ and we define n̂0 (k) to be the Fourier coefficients of the initial condition n0 (x). The strength of this approach is that it is simple to solve the diffusion equation for a single plane wave. For example, integrating the diffusion equation in the following manner Z ∞ Z ∞ ∂n −ikx ∂2n e dx = D 2 e−ikx dx (4) ∂x −∞ ∂t −∞ gives ∂ n̂(k, t) = (ik)2 Dn̂(k, t) = −k 2 Dn̂(k, t). ∂t Given the initial condition n0 (x) → n̂0 (k) the solution of (5) is 2 n̂(k, t) = n̂0 (k)e−Dk t . (5) (6) 1 An intuitive way of thinking is to note that a plane wave can be written as eikx = cos(kx) + i sin(kx). The Fourier transform thus can be interpreted as expressing a (complex) function as a superposition of real and complex sinusoidal waves. The Fourier coefficient n̂(k, t) describes how large the contribution of a wave with wave vector k ∝ 1/λ, with λ the wavelength, is in this superposition. 10 The solution of the original problem is therefore Z ∞ 1 2 n(x, t) = n̂0 (k)eikx−Dk t dk. 2π −∞ (7) We note that the high-wavenumber components (which correspond to sharp gradients) are rapidly damped, emphasising the smoothing property of diffusion. 3.1 Example Consider a distribution that is initially Gaussian (normal) about the point x = 0 at time t = 0, with standard deviation σ, n(x, 0) = √ x2 1 2πσ 2 e− 2σ2 . (8) Note that in the limit where σ → 0, this distribution corresponds to the Dirac deltafunction δ(x), a function which is localized at zero. We come back to this limit again at the end of the example. The Fourier transform of the above initial distribution is Z ∞ Z ∞ x2 2 1 1 − −ikx− x 2 2 +ikx 2σ 2σ n̂0 (k) = √ dx. (9) dx = √ e e 2πσ 2 −∞ 2πσ 2 −∞ Completing the square for the exponent i x2 1 1 h 2 2 2 2 2 4 + ikx = x + 2σ ikx = x + ikσ + k σ . 2σ 2 2σ 2 2σ 2 (10) enables (9) to be rewritten as k2 σ 2 e− 2 n̂0 (k) = √ 2πσ 2 Z ∞ e− (x+ikσ 2 )2 2σ 2 dx. (11) −∞ To calculate the above integral, which involves a complex integrand, we use the Cauchy integral formula. It states that for a complex function f (z) ∈ C, z ∈ C, integration along a closed path in the complex plane is zero, provided that f (z) has no poles inside the path: I f (z)dz = 0 (12) Introducing the substitution z = x + ikσ 2 , dz = dx, the integral (11) can be rewritten as k2 σ 2 e− 2 n̂0 (k) = √ lim 2πσ 2 R→∞ R+ikσ 2 Z z2 e− 2σ2 dz (13) −R+ikσ 2 Let’s keep R finite for the moment. We can then think of the integral as one segment of a closed curve with rectangular shape: I z2 0 = e− 2σ2 dz Z R+ikσ 2 = e −R+ikσ 2 − z2 2σ 2 Z R dz + e − z2 2σ 2 Z −R dz + R+ikσ 2 e R 11 − z2 2σ 2 Z −R+ikσ 2 dz + −R z2 e− 2σ2 dz (14) In the limit R → ∞, the second as well as the last integral vanish due to the exponential damping with large R, leading to Z R+ikσ 2 lim R→∞ −R+ikσ 2 − e z2 2σ 2 Z R dz = lim R→∞ −R z2 e− 2σ2 dz . (15) Inserting this into Eq. (13), we obtain k2 σ 2 e− 2 n̂0 (k) = √ 2πσ 2 Z ∞ x2 e− 2σ2 dx. (16) −∞ This means that we can basically drop the imaginary part in the original integral, Eq. (11). From 18.01 we know that Z ∞ √ 2 e−x = π, −∞ √ so by making a change of variable y = x/ 2σ 2 we have that n̂0 (k) = e− k2 σ 2 2 . (17) This result is worth keeping in mind: The Fourier transform of a Gaussian is a Gaussian. To obtain the full solution of the diffusion equation in real space, we have to insert n̂0 (k) into (2), Z ∞ 1 2 2 2 n(x, t) = eikx−Dk t−k σ /2 dk. (18) 2π −∞ We can do a bit of rearranging to get n(x, t) = 1 2π ∞ Z 2 2 eikx−k (Dt+σ /2) dk . (19) −∞ As before we complete the square for the exponent, ) ( 2 σ2 σ2 ix x2 2 k Dt + − ikx = Dt + k− + , 2 2 2(Dt + σ 2 /2) 4 (Dt + σ 2 /2)2 (20) so that the integral becomes − n(x, t) = e x2 4(Dt+σ 2 /2) 2π Z ∞ h −(Dt+σ 2 /2) k− e ix 2(Dt+σ 2 /2) i2 dk. (21) −∞ This is essentially the same integral that we had before, so we drop the imaginary part and change the integration variable, giving the result e − x2 4(Dt+σ 2 /2) n(x, t) = p . 4π(Dt + σ 2 /2) (22) This is the solution of the diffusion equation starting from a Gaussian distribution at time t = 0. 12 Note: • Introducing σ̃ 2 = 2(Dt+σ 2 /2), the solution is √a Gaussian with a standard deviation σ̃, i.e. the width of the solution grows like Dt in time. Similarly, the amplitude decreases like √1Dt . • Let us substitute td = σ 2 /(2D). The solution then can be written as − x2 e 4D(t+td ) n(x, t) = p . 4πD(t + td ) (23) 2 σ Remember that in the limit td = 2D → 0 the initial condition (8) corresponds to a Dirac delta function. Thus an initially Gaussian distribution of particles that is diffusing may be viewed as having originated from a delta function a time td ago. Indeed, it can be shown that diffusion will cause any form of particle distribution initially localised about zero to eventually look like a Gaussian. 4 Green’s function method This method relies on another trick for representing the solution, that is somewhat more intuitive. Now, instead of representing n in a basis of plane wave states, we will express it as a basis of states which are localised in position. This is done by using the so-called Dirac delta function, denoted δ(x − x0 ). You should think of this of a large spike of unit area that is centered exactly at the position x0 . The definition of δ is that given any function2 f (x), Z ∞ f (x0 ) δ(x − x0 )dx0 = f (x). (24) −∞ We can represent the initial distribution of particles n(x, 0) = n0 (x) as a superposition of δ-functions Z ∞ n0 (x) = n0 (x0 ) δ(x − x0 ) dx0 . (25) −∞ This formula decomposes n0 into a continuous series of “spikes”. The idea is to then understand how each spike individually evolves and then superimpose the evolution of each 2 Intuitively, one can obtain the Dirac δ-function from the normalized Gaussian (8) by letting σ → 0. Derivatives of order n of the δ-function, denoted by δ (n) , can be defined by partial integration Z ∞ Z ∞ f (x0 ) δ (n) (x − x0 ) dx0 = (−1)n f (n) (x0 ) δ(x − x0 ) dx0 . −∞ −∞ The Fourier transformation of the δ-function is given by Z ∞ δ̂(k) = e−ikx δ(x) dx = 1. −∞ Applying the inverse transformation yields a useful integral representation of the Dirac δ-function Z ∞ Z ∞ 1 1 δ(x) = eikx δ̂(k) dk = eikx dk. 2π −∞ 2π −∞ 13 spike to find the final density distribution. We define the Green’s function G(x − x0 , t) so that G(x − x0 , 0) = δ(x − x0 ), and Z ∞ n(x, t) = G(x − x0 , t) n0 (x0 ) dx0 . (26) −∞ Plugging this into the diffusion equation we see that Z ∞ Z ∞ 0 ∂ 2 G(x − x0 , t) 0 0 ∂G(x − x , t) 0 n0 (x ) n0 (x0 ) dx = D dx . ∂t ∂x2 −∞ −∞ (27) Thus G(x − x0 , t) obeys the diffusion equation and we have reduced the problem to the mathematics of solving the diffusion equation for the localised initial condition δ(x − x0 ). There are many ways of solving this problem. The one in most textbooks is to actually use the Fourier decomposition of δ(x − x0 ) and solve the equation in Fourier space, and then transform back into real space. This is an advisable procedure as the Fourier transform of δ is very simple3 ; see problem 2(a), problem set 1. We will advocate another procedure however, that is more elegant and uses an idea that we will return to later in our studies of fluids. The idea is to use dimensional analysis to determine the solution. If we look at the diffusion equation ∂n ∂2n =D 2 (28) ∂t ∂x we see that roughly ‘∂/∂t’ ∼ ‘∂ 2 /∂x2 ’. (I’ve written this in quotes because there is a sense in which this equality is meaningless.) What I mean by it is that if you have a function n which obeys a diffusion equation, taking a single time derivative of the function gives a number of about the same size as when you take two spatial derivatives. This means √ that the characteristic length scale over which n varies is of order t. Now, since the initial distribution δ √ is perfectly localised, we expect that at time t, G(x − x0 ) will have a characteristic width t. Thus, we guess a (so-called) similarity solution x − x0 0 √ . (29) G(x − x , t) = A(t) F t The time dependence of A(t) is determined by the conservation of particles. Since Z ∞ Z ∞ √ Z ∞ x F (y)dy (30) n dx = A(t) F √ dx = A(t) t t −∞ −∞ −∞ √ must be constant in time (we have changed variables from x to y = x/ t), we see that A0 A(t) = √ t (31) for some constant A0 . Now let’s just plug in √ A0 G(x, t) = √ F (x/ t) t 3 Note that in the limit td = σ 2 /(2D) → 0 the initial condition (8) approaches a Dirac delta function, so we have already ‘solved’the problem: equation (23) tells us that an initially Gaussian distribution of particles that is diffusing may be viewed as having originated from a delta function a time td ago. 14 into the diffusion equation. This gives us the following ordinary differential equation for F (y) 1 1 1 1 0 − F − yF = 3 DF 00 . (32) 3 2 2 t2 t2 Cancelling out the time factors and integrating this equation once gives 1 − F y = DF 0 . 2 (33) This equation can be immediately integrated to give F (y) = F0 e−y 2 /4D , and thus F0 (x−x0 )2 G(x − x0 , t) = √ e− 4Dt , t (34) √ R where the constant F0 = 1/ 4πD is determined by requiring that dx G = 1. Mean square displacement We would like to determine hx(t)2 i for a collection of particles starting at x0 = 0. Since G(x − x0 , t) is the solution of the diffusion equation with initial condition δ(x − x0 ), we can compute the mean square displacement from Z ∞ 2 x(t) = dx x2 G(x, t) −∞ Z ∞ x2 x2 = dx √ e− 4Dt 4πDt −∞ √ Z ∞ α 2 dx x2 e−αx (35) = √ π −∞ where α = 1/(4Dt). To evaluate the integral, note that Z ∞ 2 −αx2 dx x e −∞ d =− dα Z ∞ −αx2 dx e −∞ d =− dα r π π = . α 2α3/2 (36) which then gives 1 x(t)2 = = 2Dt. (37) 2α We have thus recovered the fundamental result that the mean square displacement of Brownian particles grows linearly in time. 15 5 5.1 Generalizations of the diffusion equation Sedimentation Consider spherical particles diffusing under the effect of a constant drift velocity u in one dimension, described by the conservation law ∂n ∂ = − Jx ∂t ∂x (38) with current ∂ n. (39) ∂x Interpreting x > 0 as the distance from the bottom of a vessel and assuming reflective boundaries at x = 0, we may think of u arising from the effects of gravity Jx = un − D −gm∗ 6πηa u= (40) where g is the gravitational acceleration, a and m∗ > 0 denote radius and effective bouyant mass4 of the particles, and η the viscosity of the fluid. The stationary zero-current solution, satisfying Jx = 0, is obtained by integrating un − D ∂ n = 0, ∂x (41) yielding an exponentially decaying density profile n(x) = Ce−x/λ (42) with characteristic sedimentation length λ=− D 6πηaD = > 0. u gm∗ (43) Sutherland and Einstein showed in 1905 that the diffusion constant D of a small particle moving in a fluid is given by kT D= , (44) 6πηa where k is the Boltzmann’s constant and T the temperature (measured on a Kelvin scale), implying that kT . (45) λ= gm∗ Note that particle shape (and mass density) enter through the buoyant mass m∗ . 4 The buoyant mass m∗ is defined as the difference between the particle mass and the mass of the liquid that is displaced by the particle. Particles heavier than water have m∗ > 0 whereas m∗ < 0 for gas bubbles. 16 5.2 Linear stability analysis for a simple pattern formation model Warm-up: Linear stability analysis of fixed points for ODEs Consider a particle (e.g., bacterium) moving in one-dimension with velocity v(t), governed by the nonlinear ODE d v(t) = −(α + βv 2 )v =: f (v). dt (46) We assume that the parameter β is strictly positive, but allow α to be either positive or negative. The fixed points of Eq. (46) are, by definition, velocity values v∗ that satisfy the condition f (v∗ ) = 0. For α > 0, there exists only p one fixed points v0 = 0. For α < 0, we find the three fixed points v0 = 0 and v± = ± −α/β. That is, the system undergoes pitchfork bifurcation at the critical parameter value α = 0. To evaluate the stability of a fixed points v∗ , we can linearize the nonlinear equation (46) in the vicinity of the fixed points by considering small perturbations v(t) = v∗ + δv(t). (47) By inserting this perturbation ansatz into (46) and noting that, to leading order, f (v + δv) ' f (v∗ ) + f 0 (v∗ ) δv = f 0 (v∗ ) δv, (48) we find that the growth of the perturbation δv(t) is governed by the linear ODE d δv(t) = f 0 (v∗ ) δv(t), dt (49) which has the solution δv(t) = δv(0) ef 0 (v ∗ )t . (50) If f 0 (v∗ ) > 0, then the perturbation will grow and the fixed point is said to be linearly unstable. whereas for f 0 (v∗ ) < 0 the perturbation will decay implying that the fixed point is stable. For our specific example, we find f 0 (v0 ) = −α , 2 f 0 (v± ) = −(α + 3v± ) = 2α (51) This means that for α > 0, the fixed point v0 = 0 is stable, indicating that the particle will be damped to rest in this case. By pcontrast, for α < 0, the fixed point v0 becomes unstable and the new fixed points v± = ± −α/β become stable; that is, for α < 0 the particle will be driven to a non-vanishing stationary speed. Equation (46) with α < 0 defines one of the simplest models of active particle motion. Stability analysis for PDEs The above ideas can be readily extended to PDEs. To illustrate this, consider a scalar density n(x, t) on the interval [0, L], governed by the diffusion equation ∂n ∂2n =D 2 ∂t ∂x 17 (52a) with reflecting boundary conditions, ∂n ∂n (0, t) = (L, t) = 0. ∂x ∂t (52b) This dynamics defined by Eqs. (52) conserves the total ‘mass’ Z L dx n(x, t) ≡ N0 , N (t) = (53) 0 and a spatially homogeneous stationary solution is given by n0 = N0 /L. (54) To evaluate its stability, we can consider wave-like perturbations n(x, t) = n0 + δn(x, t) , δn = eσt−ikx . (55) Inserting this perturbation ansatz into (52) gives the dispersion relation σ(k) = −Dk 2 ≥ 0, (56) signaling that n0 is a stable solution, because all modes with |k| > 0 become exponentially damped. Swift-Hohenberg model As a simple generalization of (52), we consider the simplest isotropic fourth-order PDE model for a non-conserved real-valued order-parameter ψ(x, t) in two space dimensions x = (x, y), given by ∂t ψ = F (ψ) + γ0 ∇2 ψ − γ2 (∇2 )2 ψ, (57) where ∂t = ∂/∂t denotes the time derivative, and ∇ = (∂/∂x, ∂/∂y) is the two-dimensional Laplacian. The force F is derived from a Landau-potental U (ψ) F =− ∂U , ∂ψ U (ψ) = a 2 b 3 c 4 ψ + ψ + ψ , 2 3 4 (58) where c > 0 to ensure stability. The appearance of higher-order spatial derivatives means that this model accounts for longer-range effects than the diffusion equation. This becomes immediately clear when one writes a (57) in a discretized form as necessary, for example, when trying to solve this equation numerically on a space-time grid: second-order spatial derivatives require information about field values at nearest neighbors, whereas fourth-order derivatives involves field values at next-to-nearest neighbors. In this sense, higher-thansecond-order PDE models, such as the Swift-Hohenberg model (57), are more ‘nonlocal’ than the diffusion equation (52). The field ψ could, for example, quantify local energy fluctuations, local alignment, phase differences, or vorticity. In general, it is very challenging to derive the exact functional dependence between macroscopic transport coefficients (a, b, c, γ1 , γ2 ) and microscopic interaction parameters. With regard to practical applications, however, it is often sufficient 18 to view transport coefficients as purely phenomenological parameters that can be determined by matching the solutions of continuum models, such as the one defined by Eqs. (57) and (58), to experimental data. This is analogous to treating the viscosity in the classical Navier-Stokes equations as a phenomenological fit parameter. The actual predictive strength of a continuum model lies in the fact that, once the parameter values have been determined for a given set-up, the theory can be used to obtain predictions for how the system should behave in different geometries or under changes of the boundary conditions (externally imposed shear, etc.). In some cases, it may also be possible to deduce qualitative parameter dependencies from physical or biological considerations. For instance, if ψ describes vorticity or local angular momentum in an isolated ‘active’ fluid, say a bacterial suspension, then transitions from a > 0 to a < 0 or γ0 > 0 to γ0 < 0, which both lead to non-zero flow patterns, must be connected to the microscopic self-swimming speed v0 of the bacteria. Assuming a linear relation, this suggests that, to leading order, a0 = δ −αv0 where δ > 0 is a passive damping contribution and αv0 > 0 the active part, and similarly for γ0 . It may be worthwhile to stress at this point that higher-than-second-order spatial derivatives can also be present in passive systems, but their effects on the dynamics will usually be small as long as γ0 > 0. If, however, physical or biological mechanisms can cause γ0 to become negative, then higher-order damping terms, such as the γ2 -term in (57), cannot be neglected any longer as they are essential for ensuring stability at large wave-numbers, as we shall see next. Linear stability analysis The fixed points of (57) are determined by the zeros of the force F (ψ), corresponding to the minima of the potential U , yielding ψ0 = 0 (59a) and b ψ± = − ± 2c r b2 a − , 4c2 c if b2 > 4ac. (59b) Linearization of (57) near ψ0 for small perturbations δψ = 0 exp(σ0 t − ik · x) (60) σ0 (k) = −(a + γ0 |k|2 + γ2 |k|4 ). (61) ψ = ψ± + ± exp(σ± t − ik · x) (62) σ± (k) = − −(2a + bψ± ) + γ0 |k|2 + γ2 |k|4 . (63) gives Similarly, one finds for the dispersion relation In both cases, k-modes with σ > 0 are unstable. From Eqs. (61) and (63), we see immediately that γ2 > 0 is required to ensure small-wavelength stability of the theory and, furthermore, that non-trivial dynamics can be expected if a and/or γ0 take negative values. In particular, all three fixed points can become simultaneously unstable if γ0 < 0. 19 Figure 1: Numerical illustration of structural transitions in the order-parameter ψ for symmetric (a) mono-stable and (b) bi-stable potentials U (ψ) with b = 0. (c) Snapshots of the order-parameter field ψ at t = 500, scaled by the maximum value ψm , for a mono-stable potential U (ψ) and homogeneous random initial conditions. (b) Snapshots of the orderparameter at t = 500 for a bi-stable potential. For γ0 −(2π)2 γ2 /L2 , increasingly more complex quasi-stationary structures arise; qualitatively similar patterns have been observed in excited granular media and chemical reaction systems. Symmetry breaking In the context biological systems, the minimal model (57) is useful for illustrating how microscopic symmetry-breaking mechanisms that affect the motion of individual microorganisms or cells can be implemented into macroscopic field equations that describe large collections of such cells. To demonstrate this, we interpret ψ as a vorticitylike 2D pseudo-scalar field that quantifies local angular momentum in a dense microbial suspension, assumed to be confined to a thin quasi-2D layer of fluid. If the confinement mechanism is top-bottom symmetric, as for example in a thin free-standing bacterial film, then one would expect that vortices of either handedness are equally likely. In this case, (57) must be invariant under ψ → −ψ, implying that U (ψ) = U (−ψ) and, therefore, b = 0 in (58). Intuitively, the transformation ψ → −ψ corresponds to a reflection of the observer position at the midplane of the film (watching the 2D layer from above vs. watching it from below). The situation can be rather different, however, if we consider the dynamics of microorganisms close to a liquid-solid interface, such as the motion of bacteria or sperms cells in the vicinity of a glass slide (Fig. 2). In this case, it is known that the trajectory of a swimming cell can exhibit a preferred handedness. For example, the bacteria Escherichia coli and Caulobacter have been observed to swim in circles when confined near to a solid surface. More precisely, due to an intrinsic chirality in their swimming apparatus, these organisms move on circular orbits in clockwise (anticlockwise) direction when viewed from inside the bulk fluid (glass surface). Qualitatively similar behavior has also been reported for sea urchin sperm swimming close to solid surfaces. Hence, for various types of swimming microorganisms, the presence of the near-by no- 20 slip boundary breaks the reflection symmetry, ψ 6→ −ψ. The simplest way of accounting for this in a macroscopic continuum model is to adapt the potential U (ψ) by permitting values b 6= 0 in (58). The result of a simulation with b > 0 is shown in Fig. 2a. In contrast to the symmetric case b = 0 (compare Fig. 1c), an asymmetric potential favors the formation of stable hexagonal patterns (Fig. 2a) – such self-assembled hexagonal vortex lattices have indeed been observed experimentally for highly concentrated spermatozoa of sea urchins (Strongylocentrotus droebachiensis) near a glass surface (Fig. 2b). Figure 2: Effect of symmetry-breaking in the Swift-Hohenberg model. (a) Stationary hexagonal lattice of the pseudo-scalar angular momentum order-parameter ψ, scaled by the maximum value ψm , as obtained in simulationsof Eqs. (57) and (58) with b > 0, corresponding to a broken reflection symmetry ψ 6→ −ψ. Blue regions correspond to clockwise motions. (b) Hexagonal vortex lattice formed spermatozoa of sea urchins (Strongylocentrotus droebachiensis) near a glass surface. At high densities, the spermatozoa assemble into vortices that rotate in clockwise direction (inset) when viewed from the bulk fluid. 21
