Influence of Two Dietary Fats on the Composition of Emu... L. M. Beckerbauer,* ‡ and D. C. Beitz*
advertisement
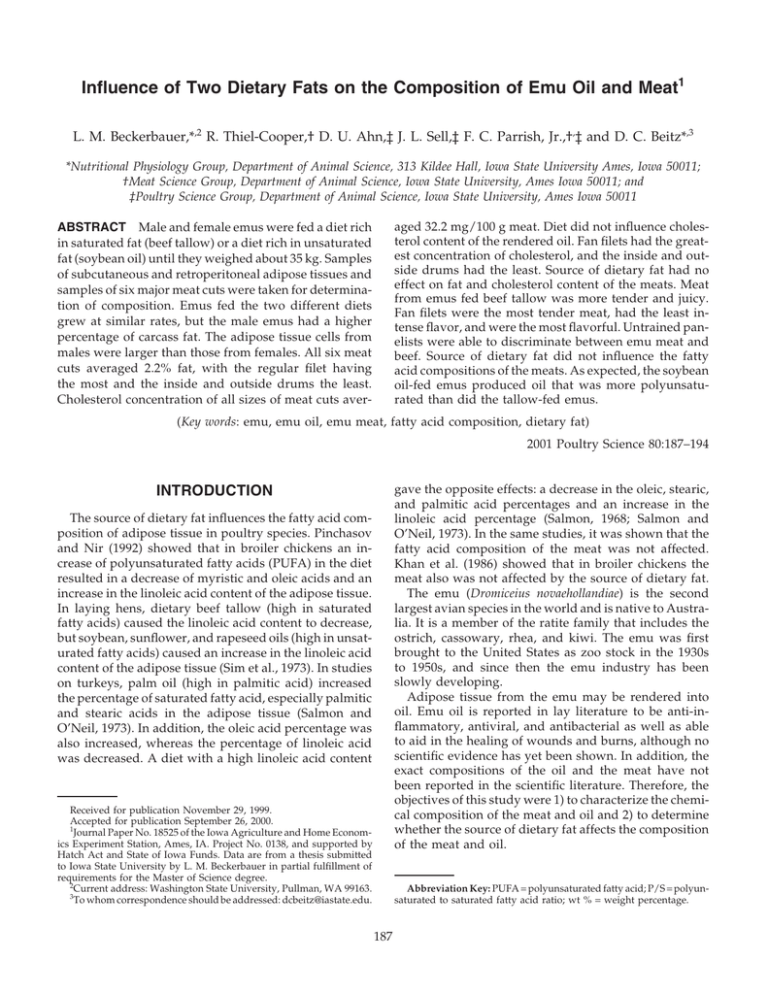
Influence of Two Dietary Fats on the Composition of Emu Oil and Meat1 L. M. Beckerbauer,*,2 R. Thiel-Cooper,† D. U. Ahn,‡ J. L. Sell,‡ F. C. Parrish, Jr.,†,‡ and D. C. Beitz*,3 *Nutritional Physiology Group, Department of Animal Science, 313 Kildee Hall, Iowa State University Ames, Iowa 50011; †Meat Science Group, Department of Animal Science, Iowa State University, Ames Iowa 50011; and ‡Poultry Science Group, Department of Animal Science, Iowa State University, Ames Iowa 50011 aged 32.2 mg/100 g meat. Diet did not influence cholesterol content of the rendered oil. Fan filets had the greatest concentration of cholesterol, and the inside and outside drums had the least. Source of dietary fat had no effect on fat and cholesterol content of the meats. Meat from emus fed beef tallow was more tender and juicy. Fan filets were the most tender meat, had the least intense flavor, and were the most flavorful. Untrained panelists were able to discriminate between emu meat and beef. Source of dietary fat did not influence the fatty acid compositions of the meats. As expected, the soybean oil-fed emus produced oil that was more polyunsaturated than did the tallow-fed emus. ABSTRACT Male and female emus were fed a diet rich in saturated fat (beef tallow) or a diet rich in unsaturated fat (soybean oil) until they weighed about 35 kg. Samples of subcutaneous and retroperitoneal adipose tissues and samples of six major meat cuts were taken for determination of composition. Emus fed the two different diets grew at similar rates, but the male emus had a higher percentage of carcass fat. The adipose tissue cells from males were larger than those from females. All six meat cuts averaged 2.2% fat, with the regular filet having the most and the inside and outside drums the least. Cholesterol concentration of all sizes of meat cuts aver- (Key words: emu, emu oil, emu meat, fatty acid composition, dietary fat) 2001 Poultry Science 80:187–194 gave the opposite effects: a decrease in the oleic, stearic, and palmitic acid percentages and an increase in the linoleic acid percentage (Salmon, 1968; Salmon and O’Neil, 1973). In the same studies, it was shown that the fatty acid composition of the meat was not affected. Khan et al. (1986) showed that in broiler chickens the meat also was not affected by the source of dietary fat. The emu (Dromiceius novaehollandiae) is the second largest avian species in the world and is native to Australia. It is a member of the ratite family that includes the ostrich, cassowary, rhea, and kiwi. The emu was first brought to the United States as zoo stock in the 1930s to 1950s, and since then the emu industry has been slowly developing. Adipose tissue from the emu may be rendered into oil. Emu oil is reported in lay literature to be anti-inflammatory, antiviral, and antibacterial as well as able to aid in the healing of wounds and burns, although no scientific evidence has yet been shown. In addition, the exact compositions of the oil and the meat have not been reported in the scientific literature. Therefore, the objectives of this study were 1) to characterize the chemical composition of the meat and oil and 2) to determine whether the source of dietary fat affects the composition of the meat and oil. INTRODUCTION The source of dietary fat influences the fatty acid composition of adipose tissue in poultry species. Pinchasov and Nir (1992) showed that in broiler chickens an increase of polyunsaturated fatty acids (PUFA) in the diet resulted in a decrease of myristic and oleic acids and an increase in the linoleic acid content of the adipose tissue. In laying hens, dietary beef tallow (high in saturated fatty acids) caused the linoleic acid content to decrease, but soybean, sunflower, and rapeseed oils (high in unsaturated fatty acids) caused an increase in the linoleic acid content of the adipose tissue (Sim et al., 1973). In studies on turkeys, palm oil (high in palmitic acid) increased the percentage of saturated fatty acid, especially palmitic and stearic acids in the adipose tissue (Salmon and O’Neil, 1973). In addition, the oleic acid percentage was also increased, whereas the percentage of linoleic acid was decreased. A diet with a high linoleic acid content Received for publication November 29, 1999. Accepted for publication September 26, 2000. 1 Journal Paper No. 18525 of the Iowa Agriculture and Home Economics Experiment Station, Ames, IA. Project No. 0138, and supported by Hatch Act and State of Iowa Funds. Data are from a thesis submitted to Iowa State University by L. M. Beckerbauer in partial fulfillment of requirements for the Master of Science degree. 2 Current address: Washington State University, Pullman, WA 99163. 3 To whom correspondence should be addressed: dcbeitz@iastate.edu. Abbreviation Key: PUFA = polyunsaturated fatty acid; P/S = polyunsaturated to saturated fatty acid ratio; wt % = weight percentage. 187 188 BECKERBAUER ET AL. TABLE 1. Fatty acid profiles of soybean oil and beef tallow fed to emus Fatty acid Soybean oil Beef tallow (wt %) Myristic (14:0) Palmitic (16:0) Palmitoleic (16:1) Stearic (18:0) Oleic (18:1) Linoleic (18:2) Linolenic (18:3) Other 2 ND1 10.5 ND 3.8 22.0 54.9 8.1 0.7 2.9 23.6 2.9 21.0 45.2 1.8 0.1 2.5 ND = none detected. Weight percentage. 1 2 MATERIALS AND METHODS Twenty-four emus, 12 males and 12 females, approximately 18 wk old, were obtained from commercial emu producers. Three males and three females were allotted to each of four pens. Each pen consisted of a 17.1 × 4.3 m outdoor fenced run and a 2.1 × 3.1 m indoor shelter. After a 2-wk acclimatization period, the emus were switched from a commercial emu grower diet (crumble form) to an all-mash diet prepared at our research farm. This grower diet was formulated to contain 21% CP and 2,900 kcal of MEn/kg, and concentrations of vitamins and minerals were considered to be adequate for growing emus. All emus were changed to a diet that contained 17.5% CP and 2,900 kcal of MEn/kg when they were 38 wk old. When the emus were 46 wk old (March 4), each of two pre-experimental diets was assigned randomly to two pens. Because the experimental diets were to contain relatively high concentrations of supplemental fat (8%), the pre-experimental, transition diets, which contained 5% soybean oil or 5% beef tallow, were fed for 2 wk. Fatty acid compositions of the soybean oil and beef tallow used in the pre-experimental and experimental diets are shown in Table 1. The respective pens of emus then were changed to diets containing 8% soybean oil or 8% beef tallow (Table 2). The experimental diets contained 17.5% CP and 2,900 kcal of MEn/kg. Water and feed were supplied ad libitum. Body weight and feed consumption data were recorded at 4-wk intervals. The experimental diets were fed to emus during the mild midwestern spring season. Because of differences in weight gains among individual emus and restrictions on the dates at which the emus could be processed at a commercial facility,4 the emus were slaughtered in two different groups (May 7 and June 4). Six males and eight females, selected on the basis of heaviest BW, were processed at approximately 57 wk of age, 9 wk after start of feeding the experimental diets. The remaining six males and four females were processed at 61 wk of age, after 13 wk of being fed the experimental diets. At time of slaughter, male emus 4 Butcher Shop of Iowa, Inc., Audubon, IA 50025. averaged 35.9 kg BW (individual weights ranged from 32.9 to 38.8 kg), whereas average BW of females was 35 kg (individual weights ranged from 32.7 to 38.7 kg). Because of substantial feed wastage and erratic eating patterns by the emus, average feed consumption and feed efficiency data were deemed meaningless and were not reported here. When the emus were slaughtered, subcutaneous adipose tissue over the back and retroperitoneal adipose tissue were collected. Meat cuts collected included the fan, flat, and regular filets and inside and outside drums. The carcass was allowed to chill at 4 C for 24 h, and then the adipose tissues and meat cuts were collected, vacuum-packaged, and stored at −20 C until analyses, which was within about 3 mo. Rendering of Oil Adipose tissue was thawed at 4 C for at least 24 h prior to rendering. Tissue was weighed, cubed, and homogenized in a Waring blender purged with nitrogen. This resulting homogenate was transferred to a double boiler pan, purged with nitrogen, and heated at 70 C for 40 min to yield the rendered oil. Sodium sulfate (100 g for every 500 g of adipose tissue) was added to the oil to remove any water. The oil then was filtered through a Buchner funnel and number three Whatman paper under a vacuum to yield the emu oil. At all times, exposure to light and air was minimized by working quickly and keeping pans covered. Oil was stored under nitrogen at room temperature in amber bottles. TABLE 2. Ingredient and nutrient composition of finisher diets Ingredient Corn Soybean meal Wheat middlings Dehydrated alfalfa meal Sunflower meal Meat and bone meal Soybean oil or beef tallow1 Vitamin premix2 Mineral premix3 Other Nutrient (as-fed basis) CP Total sulfur amino acids Methionine Lysine Calcium Nonphytate phosphorus Sodium Metabolizable energy, kcal/kg % 34.32 11.73 20.00 10.00 10.00 4.49 8.00 0.30 0.30 0.86 17.503 0.65 0.36 0.88 0.95 0.45 0.25 2,905 1 Diets containing soybean oil or beef tallow averaged 18.31 and 18.26% CP, respectively, on an as-fed basis, according to laboratory analysis. 2 Supplied per kilogram of diet: vitamin A (retinyl acetate), 8,065 IU; cholecalciferol, 1,580 IU; vitamin E (dl-α-tocopheryl acetate), 15 IU; vitamin B12, 16 µg; vitamin K (menadione sodium bisulfite), 1.98 mg; riboflavin, 7.8 mg; pantothenic acid, 12.8 mg, niacin, 75 mg; choline, 509 mg; folic acid, 1.62 mg; biotin, 270 µg. 3 Supplied per kilogram of diet: manganese, 70 mg; zinc, 40 mg; ferrous sulfate, 37 mg; copper, 6 mg; selenium, 0.15 mg; sodium chloride, 2.6 g. INFLUENCE OF DIETARY FATS ON EMU OIL AND MEAT Chemical Analyses Adipose tissue cellularity was determined by the methods of Etherton et al. (1977) by using a Coulter Counter.5 The percentage of water was determined by lyophilization. Fatty acid composition of lipids extracted from the oil and the meat (Bligh and Dyer, 1959; Lepage and Roy, 1986) was determined by using a gas chromatograph6 fitted with a Supelco 2380 column.7 Column temperature was 170 C; the injector temperature was 210 C and that of the detector was 230 C. Cholesterol concentrations of the oil and the meat were determined using a kit (Catalog No. 352-50)8 based on the method of Allain et al. (1974). The phospholipid content of the oil was determined by using a kit (Catalog No. 670-A) with the trichloroacetic acid step omitted. This kit is based on the method developed by Fiske and SubbaRow (1925). The pH measurements were done by the method of Bendall (1979). Sensory Panel Analysis Sensory panel and triangle tests were conducted according to procedures outlined in the American Meat Science Association cookery guidelines (1995). The sensory panel comprised 15 panelists who were trained according to procedures described in the same publication. Panelists were men and women ranging in age from 20 to 60 yr. Panelists were trained to evaluate the sensory attributes of broiled fan filets and outside drums for initial tenderness, initial juiciness, flavor intensity, flavor, and amount of connective tissue. Training consisted of presenting the panelists with samples of meat with known tenderness, juiciness, and flavor. Panelists scored each sample for initial tenderness, initial juiciness, flavor intensity, flavor, and connective tissue by using an 8-point descriptive scale (e.g., where 1 = extremely tough to 8 = extremely tender). Outside drums and fan filets from each emu were cooked by placing the frozen cuts in an industrial broiler9 10.16 cm from the heat source (288 C) and were turned halfway (33 C) through cooking. The end-point internal temperature of doneness was 66 C. To achieve this endpoint temperature, cuts were removed when the internal temperature reached 64 C, as determined by thermometers inserted into the geometric center of each cut. Cooked cuts were sectioned into 1.27 cm cubes, placed in aluminum serving cups, and immediately served to the panelists. Panelists were seated in individual booths illuminated with red light and had room-temperature water and crackers for clearing the palate between samples. Panelists evaluated eight samples at any sitting. 5 Coulter Electronic, Hialeah, FL 33010. Varian 3400; Varian Analytical Instruments, Palo Alto, CA 94303. 7 Supelco, Inc., Bellefonte, PA 16823. 8 Sigma Diagnostics, St. Louis, MO 63178. 9 General Electric, Chicago Heights, IL 60411. 10 Cooper Instruments, Middletown, CT 06457. 6 189 Each panelist evaluated each sample once. The scores for each panelist were used for statistical analysis. Triangle Test of Emu Meat and Beef A triangle test with 10 of 24 animals as a subsample was conducted. Inside drum was used and compared with beef eye of round. Emu was cooked, beginning in the frozen state, on a broiler pan in a conventional oven at 177 C. Temperature was measured in the geometric center of each cut with an Electrotherm TM99A digital thermometer.10 Emu meat was turned over at 24 C and cooked to a final temperature of 65 C. Beef was 4 to 7 C internally prior to cooking and was cooked under the same conditions and to the same end-point temperature as emu meat. Emu and beef samples were assigned random threedigit codes and were assigned to random panels. Samples were presented on paper plates divided into three sections with random sample numbers assigned to each section. Samples were presented warm to trained panelists in a darkened room with samples under blue light. Panelists were instructed to make difference determinations based only on flavor. Twenty panelists were used for each panel. Statistical Analysis Data, except the taste panel and triangle test data, were analyzed by two-way analysis of variance to determine the influence of dietary treatment and gender and their interaction on the dependent variables (SAS, 1994). Taste panel data were analyzed by using the GLM procedure. Triangle test data were analyzed by the method of Roessler et al. (1978) in which the number of correct judgements from a given number of trials was matched with a probability table. RESULTS Meat Composition Lipid and Dry Matter Content. The overall average lipid concentration of all cuts (not based on diet or gender) was 2.15%. Sales and Horbanczuk (1998) reported a range of 0.9 to 1.2% lipid in four different muscles. The regular filet of meat had the greatest percentage of lipids (Table 3) at 3.55% (P < 0.05). The inside and outside drums had the smallest percentage of lipids, although it was not different (P > 0.05) from that of the other cuts. Gender and the two sources of dietary fat had no influence on lipid content of the individual cuts of emu meat (P > 0.05). The overall average percentage of dry matter for all cuts was 24.8%, which is similar to that reported by Sales and Horbanczuk (1998). There was no effect of gender or dietary fat on dry matter content of individual emu meats (data not shown). The ultimate pH (pH after 24 h of chilling at 4 C) of the thigh muscles was 5.65. 190 BECKERBAUER ET AL. TABLE 3. Effect of diet and gender on percentage of lipids in meat cuts from emus1 Filet Diet and gender Fan Female Male SBO BT Overall average2 2.04 2.00 2.27 1.77 2.02 Drum Flat ± ± ± ± ± 0.18 0.19 0.22 0.10 0.58 Regular ± ± ± ± ± 1.65 1.96 1.73 1.80 1.78 0.16 0.16 0.17 0.17 0.16 3.02 3.10 3.86 3.25 3.55 Inside (% of wet ± 0.31a ± 0.48a ± 0.44a ± 0.41a ± 0.43a meat) 2.00 ± 1.43 ± 1.56 ± 1.87 ± 1.71 ± All cuts3 Outside 0.35 0.14 0.23 0.32 0.28 1.85 1.49 1.66 1.69 1.67 ± ± ± ± ± 0.32 0.10 0.31 0.16 0.24 2.10 2.20 2.22 2.09 2.15 ± ± ± ± ± 0.41 0.25 0.38 0.30 0.34 Greater amount than other means in same row, except for all cuts data (P < 0.05). Means in same row for 12 emus ± SE. SBO = soybean oil; and BT = beef tallow. Female and male averages are not dependent on diet. Soybean and beef tallow averages are not dependent on gender. 2 Means in same row for 24 emus ± SE. 3 All cuts were determined by averaging the values for the five cuts of meat together. a 1 Fatty Acid Composition. The fatty acid composition of the fan filet, as representative of emu meat, was determined. No effects of gender or source of dietary fat were observed (P > 0.05). The major saturated fatty acid was palmitic acid (16:0) at 19.6%; the major monounsaturated fatty acid was oleic acid (18:1) at 41.1%, and the major polyunsaturated fatty acid (PUFA) was linoleic acid at 23.5%. Palmitoleic acid (16:1) averaged 3.8%, stearic acid (18:0) 10.0%, and linolenic acid (18:3) 1.5%. In summary, the fan cut had 30% saturated fatty acids and 70% unsaturated fatty acids, with 64% of the unsaturated fatty acids being monounsaturated fatty acids and 36% being PUFA. Cholesterol Concentration. The cholesterol concentrations of all individual cuts of emu meat are presented in Table 4. No effect of gender on cholesterol concentration of any of the cuts of emu meat was observed. Generally, the meat from soybean oil-fed emus contained slightly more cholesterol than did that from beef tallowfed emus; this difference, however, was significant (P < 0.05) only for the flat filet and the inside drum. Of all the cuts, the fan filet had the highest concentration of cholesterol (P < 0.05). The inside and outside drums had the least cholesterol, although not significantly less (P > 0.05). The average of all meat cuts (not based on diet or gender) was 32.2 mg cholesterol/100 g of meat. Sensory Panel Analysis To evaluate consumer acceptability of emu meat and whether source of dietary fat influenced that acceptability, a sensory panel was used to evaluate specific sensory qualities of meats from emus fed supplemental soybean oil or beef tallow and of meats of two different cuts. Meat from the emus fed beef tallow was more tender and more juicy and had less connective tissue than did that from emus fed soybean oil (P < 0.01) (Table 5). In general, fan filets were more tender, more bland (flavor less intense), and more flavorful (less off-flavors) and had less connective tissue than did the outside drum (P < 0.05). During the sensory panel study, some panelists indicated that the emu meat tasted very much like beef. Therefore, a triangle test was conducted by using the inside drum of emu meat and eye of round of beef to determine if untrained panelists could discriminate between the two types of meat. Eye of round of beef was chosen because preliminary studies indicated that it most closely resembled inside drum of emu meat for fiber texture. No differences (P < 0.02) were found between panelists in their ability to discriminate between individual samples (data not shown). Data were reported as correctness or incorrectness of panelist to iden- TABLE 4. Effect of diet and gender on cholesterol concentration of meat cuts from emus1 Filet Diet and gender Fan Female Male SBO BT Overall average2 42.9 44.1 45.4 41.6 43.5 Drum Flat Regular Inside Outside All cuts3 (mg/100 g of meat) ± ± ± ± ± 2.2 4.3 2.4 2.7 2.5c 31.5 33.3 32.9 31.9 32.4 ± ± ± ± ± 1.3 2.2 1.6a 2.0a 1.8 27.9 30.9 30.4 28.4 29.4 ± ± ± ± ± 2.5 2.2 1.3 3.1 2.3 28.3 26.2 28.7 27.8 28.2 ± ± ± ± ± 1.9 1.1 1.9b 1.1b 1.1 29.5 27.0 28.7 27.8 28.2 ± ± ± ± ± 1.7 1.8 1.6 1.8 1.7 32.1 32.3 32.3 31.2 32.2 ± ± ± ± ± 2.6 2.9 2.4 2.9 2.7 a,b Values within a column with same superscript in a column are different (P < 0.05). Values with no superscript are not different (P > 0.05). c Fan cut of meat had more cholesterol (P < 0.05) than did the other cuts of meat, which were similar. 1 Means in same row for 12 emus ± SE. SBO = soybean oil; BT = beef tallow. Female and male averages are not dependent on diet. Soybean and beef tallow averages are not dependent on gender. 2 Means in same row for 24 emus ± SE. 3 All cuts determined by averaging the values for the five individual cuts of meat. 191 INFLUENCE OF DIETARY FATS ON EMU OIL AND MEAT TABLE 5. Sensory attributes of two cuts of emu meat from two dietary treatments Treatment2 Cut of meat Sensory attributes1 Soybean oil Tallow Fan filet Outside drum Tenderness Juiciness Flavor intensity Flavor Connective tissue 4.35B 4.49B 3.00 3.00 4.89B 5.10A 4.94A 3.00 3.00 5.29A 5.05A 3.00 5.06b 4.61A 5.38A 4.39B 3.00 5.31a 4.23B 4.79B Values for source of fat treatment and cut of meat are different (P < 0.01). Values for source of fat treatment and cut of meat are different (P < 0.05). 1 Tenderness: 1 = extremely tough to 8 = extremely tender; juiciness: 1 = extremely dry to 8 = extremely juicy; flavor intensity: 1 = extremely bland to 8 = extremely flavorful; Flavor: 1 = extremely off-flavor to 8 = extremely flavorful; connective tissue: 1 = abundant to 8 = none. 2 Values for each treatment are averages for fan filets and outside drums. A,B a,b tify the odd sample in the triangle test (Table 6). In summary, panelists were able to discriminate between meat from emus and from beef cattle. Adipose Tissue and Emu Oil Characterization Weight of Adipose Tissue. Weights of retroperitoneal adipose tissue did not differ according to gender, averaging 1.30 and 1.36 kg per male and female, respectively. Average weight of subcutaneous back adipose tissue of males, however, exceeded (P = 0.001) that of females, averaging 3.22 and 1.84 kg per male and female, respectively. The yields of adipose tissue were less than those generally reported for commercial emus grown to heavier weights. Cellularity of Adipose Tissue. The adipose tissues from the emus were characterized by quantifying the number of adipocytes per unit weight of adipose tissue. Feeding the two different types of fats did not influence the number of adipocytes per milligram of adipose tissue (Table 7). When the data for all tested emus were combined, the retroperitoneal adipose tissue, but not the subcutaneous adipose tissue, from female emus had more adipocytes (1,112 cells/mg tissue) than did the same tissue from the males (794 cells/mg tissue) (P < 0.05). The average distribution of adipocytes of different sizes in subcutaneous and retroperitoneal adipose tissues is presented in Figure 1. At most size categories, the number of adipocytes as a percentage of the total TABLE 6. Results of a triangle test to distinguish between emu meats and beef Correctness of identity Type of meat Correct (% of time) Incorrect (% of time) Meat from soy-fed emus1 Meat from tallow-fed emus1 Both emu meats Beef1 Total of all tests 71.7 76.0 77.0 70.7 74.6 28.3 24.0 23.0 29.3 25.4 1 Reported item was the odd sample in the triangle test. was similar (P < 0.05) except for the categories of 127 to 200 µm in diameter, in which the retroperitoneal adipose tissue had more large cells (P < 0.05). The average diameter of adipocytes from the retroperitoneal adipose tissue was 82 µm, which was greater (P < 0.05) than the average diameter of 68 µm for adipocytes from the subcutaneous adipose tissue. Composition of Emu Oil. The average lipid content of the oil from the subcutaneous adipose tissue was 98.8% and that from the retroperitoneal adipose tissue was 98.0% (data not shown). There was no effect of diet or gender on the lipid content of the oil (P < 0.05). No phospholipids were detected in the oil because of extraction of oil from adipose tissue by rendering. To evaluate the effect of gender and source of dietary lipid on quality of the emu oil, the concentration of individual fatty acids of lipids in the emu oil was determined. Results are presented in Figures 2 and 3. The major unsaturated component of the oil from the subcutaneous adipose tissue from all emus was oleic acid at 46 weight percentage (wt %), and the major saturated acid component was palmitic acid at 19 wt % (Figure 2). The major unsaturated component in the oil rendered from the retroperitoneal adipose tissue (Figure 3) was also oleic acid at 43 wt %; the major saturated fatty acid was palmitic acid at 18 wt %. The concentration of linoleic acid, the major PUFA, averaged 23 wt % for oil from subcutaneous adipose tissues for all emus; linoleic acid concentration was 22 wt % in the retroperitoneal adipose tissue. Fatty acid composition was also affected by the type of adipose tissue from which the oil was rendered. The oil from the subcutaneous adipose tissue of emus fed both diets had higher percentages of lauric and linoleic acids (P < 0.05) and had a lower percentage of stearic acid (P < 0.05) than did the retroperitoneal adipose tissue from the same emus. Other fatty acids were similar between the two anatomical sites of adipose tissue (P > 0.05). Feeding of soybean oil resulted in a greater concentration of linoleic acid (P < 0.05) and less palmitic acid (P < 0.05) in the rendered emu oil from the subcutaneous and retroperitoneal adipose tissues. In addition, soybean 192 BECKERBAUER ET AL. TABLE 7. Effect of diet and gender on cellularity of subcutaneous and retroperitoneal adipose tissues Anatomical site Subcutaneous Retroperitoneal Diet Male Female Male Soybean oil Beef tallow (cells/mg tissue) 1,121 ± 1521 1,109 ± 1522 971 ± 1523 715 ± 1522 Female (cells/mg tissue) 1,002 ± 1021 903 ± 1022 1,313 ± 1023 712 ± 1022 a The average number of cells per milligram in the retroperitoneal adipose tissue differed between the two genders (P < 0.05). No other gender or dietary treatment differences were observed (P > 0.05). 1 Mean for four emus ± SE. 2 Mean for three emus ± SE. 3 Mean for two emus ± SE. oil feeding increased the linolenic acid content (P < 0.05) of the retroperitoneal adipose tissue. Other fatty acids were not affected by the source of dietary fat (P > 0.05). The PUFA to saturated fatty acid ratio (P/S) in oil from subcutaneous adipose tissue of tallow-fed emus was 0.60; the P/S for oil from the same tissue of soybean oilfed emus increased to 1.40. The ratios were 0.77 and 0.97, respectively, for the oil from retroperitoneal adipose tissues of tallow-fed and soybean oil-fed emus. Gender also affected the fatty acid composition of the oil. The male emus had a greater percentage of palmitic acid than did the females (P < 0.05) and slightly less oleic acid in both adipose tissues. Other fatty acids were not affected (P > 0.05) by gender. There was no effect of diet or gender on the cholesterol concentration of the emu oil (P > 0.05). The cholesterol concentration of the emu oil from the subcutaneous adipose tissue from all emus was 29.3 mg/100 g of tissue. This concentration is lower than that of the retroperitoneal adipose tissue, which had 41.2 mg of cholesterol/ 100 g of tissue (P < 0.05). FIGURE 1. Distribution of sizes of adipocytes in adipose tissues. Values for the subcutaneous adipose tissue are the mean for five male emus. Values for the retroperitoneal adipose tissue are for three female emus. Error bars are plus SE. DISCUSSION Type of dietary lipid and gender did not affect the content of lipids in individual cuts of meat from the emu carcasses (Table 3). The fatty acid composition of the meat also was not affected by the change in dietary lipids. This lack of change is an expected result, because generally the fatty acid composition of lipids of commonly consumed meats is not greatly influenced by the diet. For example, studies by Salmon and O’Neil (1978) and Khan et al. (1986) showed that avian muscle is not as susceptible to dietary modification as is the adipose tissue. Emu meat contains similar concentrations of palmitic, palmitoleic, and linolenic acids; less amounts of stearic acid and the polyunsaturated 20- and 22-carbon fatty acids; and greater amounts of oleic and linoleic acids than similar cuts of meat from African Black ostriches of 8 to 14 mo of age (Sales, 1998). The P/S for the emu and ostrich meats are similar (0.87 vs. 0.91). This ratio is 0.84 in light chicken meat, 0.97 in dark chicken meat, and 0.70 in separable chicken adipose tissue (Decker and Cantor, 1992). The regular filet of emu meat contained from 3.0 to 3.9% total fat, and the drum meat contained 1.4 to 2.0% total fat. For comparison, the total fat content of white chicken meat is around 1.7% and that in dark meat is about 4.3%. Cholesterol content of meats of emus is less than that in meats of ostriches, which ranged from 56.6 to 71.2 mg/100 g of meat from six different muscles (Sales, 1998; Sales and Horbanczuk, 1998). The cholesterol concentration in the emu meat was higher in the emus fed the soybean oil diet versus emus fed the beef tallow diet. This effect is similar to that observed for swine that were fed a soybean oil versus a beef tallow diet (Wiggers et al., 1980; Walsh et al., 1983). These observations lead to the conclusion that diets high in PUFA result in an increased deposition of cholesterol in tissues. Spritz and Mishkel (1969) proposed a possible reason for this effect. They have suggested that a decrease in the ability of low-density lipoproteins to carry cholesterol occurs when PUFA are introduced into the diet because the PUFA have greater space-occupying requirements inasmuch as they are not as flexible as the saturated fatty acids. INFLUENCE OF DIETARY FATS ON EMU OIL AND MEAT FIGURE 2. Fatty acid composition of oil rendered from subcutaneous adipose tissue. wt. % = weight percentage of individual fatty acids to total fatty acids in the oil. Values are the mean of 12 emus, and error bars are plus SE. Effects of dietary lipids and cut of meat were detected by the sensory panel. Emus fed beef tallow produced cuts of meat that were more tender and more juicy and had less connective tissue than did similar cuts from emus fed soybean oil. Panelists, however, did not find a difference in flavor or flavor intensity and tended to score these categories very near the center of the scale, indicating that emu meat is in the mid-range for flavor intensity and had no significant off-flavor. Fan filets, which are emu cuts with the greatest consumer appeal, were more bland, flavorful, and tender than the outside drums. Evidently, the more flavor intense outside drum contained more aromatic components than did the fan filet because the lipid contents of the two cuts of emu meat were similar (Wasserman, 1979). On the basis of results from a triangle test (Roessler et al., 1978), consumers are able to distinguish between emu meat and beef. Diet did affect the fatty acid composition of emu oil. In both anatomical sites of adipose tissue, the concentration of linoleic acid was significantly different. The emus fed the soybean oil diet had a greater percentage of linoleic acid in the oil from both adipose tissues than did those from emus fed the beef tallow diet. Only in the oil from the retroperitoneal adipose tissue was a difference observed in the percentage of linolenic and palmitic acids. Here, the oil from soybean oil-fed emus had a higher percentage of linolenic acid, and the oil from the beef tallow-fed emus had a greater percentage of palmitic acid. On the basis of other feeding studies with monogastric animals with similar dietary lipids (Leszczynski et al., 1992; Larick et al., 1990; Sim et al., 1973; Salmon and O’Neil, 1973), these changes in fatty acid composition were expected, although the magnitude of the difference in linoleic acid content was less than that in pigs and poultry. Two possible reasons for this lesser change are derived from studies with chickens 193 (Pinchasov and Nir, 1992). First, the addition of beef tallow or soybean oil to the emu diet was initiated after the majority of triacylglycerols might have been deposited in the adipocytes, and, second, the deacylation/ reacylation of triacylglycerols with linoleic acid is comparatively slower in the emu. The fatty acid composition of emu oil has been reported previously by Brown et al. (1995); the diet of the emus in that study was not reported. They, however, reported that emu oil has 41.8 wt % oleic acid, 21.4 wt % palmitic acid, and 20.6 wt % linoleic acid. The oil from the emus in the current study fed beef tallow had more oleic acid (50.3 wt %), less palmitic acid (19.2 wt %), and less linoleic acid (18.2 wt %). The oil from the emus fed the soybean oil had slightly more oleic acid (41.63 wt %), less palmitic acid (16.9 wt %), and more linoleic acid (28.5 wt %). Again, these data show that the diet of the emus can affect the fatty acid composition and that this composition can be manipulated by feeding diverse dietary lipids to give a desired composition of emu oil. Palmitic acid (23.4 wt %), stearic acid (6.5 wt %), palmitoleic acid (6.2 wt %), oleic acid (40.3 wt %), linoleic acid (21.1 wt %), and linolenic acid (1.1 wt %) are the major long-chain fatty acids in separable chicken adipose tissue (Decker and Cantor, 1992). Adipose tissues from the subcutaneous and retroperitoneal sites differed in concentrations of cholesterol. There was 1.5 times greater concentration of cholesterol in the retroperitoneal tissue than in the subcutaneous adipose tissue. This difference was not caused by differences in sizes of adipocytes from the two anatomical sites, because the subcutaneous adipose tissue contained an average of 979 adipocytes/mg and the retroperitoneal adipose tissue contained an average of 982 adipocytes/ mg. Oil from males tended to have greater cholesterol concentrations, which is unexpected because the adipose FIGURE 3. Fatty acid composition of emu oil rendered from retroperitoneal adipose tissue. wt. % = weight percentage of individual fatty acids to total fatty acids in the oil. No differences were detected between the two genders. Values are the mean of 12 emus, and error bars are plus SE. 194 BECKERBAUER ET AL. tissues from males tended to have fewer cells per unit of weight. In conclusion, emu meat is low in fat (2.2%) and low in cholesterol (32.2 mg/100 g of tissue) relative to other commonly consumed meats, except for white meat of chickens and turkeys. The cholesterol concentration of the emu oil was not affected by the diet but was dependent on the tissue from which it was derived, because that from retroperitoneal adipose tissue had 1.5 times more cholesterol. Fatty acid composition of emu oil can be influenced by the source of dietary lipids; composition of emu oil is reflective of the source of the dietary lipid. Feeding either soybean oil or beef tallow to emus produced acceptable and distinctive emu meat that was distinguishable from beef by taste panelists. ACKNOWLEDGMENTS This research was supported by grants from the American Emu Association (Dallas, TX 75374) and the Iowa Emu Association (Iowa Falls, IA 50126). The authors also acknowledge the excellent assistance of the staff of the Poultry Science Center in feeding and caring for the emus, of Shelley Oren (Iowa State University, Ames, IA 50011) and Karen Kendrick (Iowa State University, Ames, IA 50011) in the laboratory, and of Gerd Bobe (Iowa State University, Ames, IA 50011) for statistical analyses. REFERENCES Allain, C. C., L. S. Poon, C.S.G. Chan, W. Richmond, and P. C. Fu, 1974. Enzymatic determination of total cholesterol. Clin. Chem. 20:470–475. American Meat Science Association (AMSA), 1995. Research Guidelines for Cookery Sensory Evaluation and Instrumental Tenderness Measurements of Fresh Meat. National Live Stock and Meat Board, Chicago, IL. Bendall, J. R., 1979. Relations between muscle pH and important biochemical parameters during the post-mortem changes in mammalian muscles. Meat Sci. 3:143–157. Bligh, E. G., and W. J. Dyer, 1959. A rapid method of total lipid extraction and purification. Can. J. Biochem. Physiol. 37:911–917. Brown, M. A., M. C. Craig-Schmidt, and P. C. Smith, 1995. Fatty acid composition of emu. Inform 6:470. Decker, E. A., and A. H. Cantor, 1992. Pages 137–167 in: Fatty Acids in Foods and Their Health Implications. C. H. Chow, ed. Marcel Dekker, Inc. New York, NY. Etherton, T. D., E. H. Thompson, and C. E. Allen, 1977. Improved techniques for studies of adipocyte cellularity and metabolism. J. Lipid Res. 18:552–557. Fiske, C. H., and Y. SubbaRow, 1925. The calorimetric determination of phosphorus. J. Biol. Chem. 66:375. Khan, B., S. Patel, and D. J. Malin, 1986. The influence of type and level of dietary fat upon fatty acid composition in the muscle tissue of broiler chickens. Trans. Biochem. Soc. 14:897–898. Larick, D. K., B. E. Turner, W. D. Schoenherr, M. T. Coffey, and D. H. Pilkington, 1990. Volatile compound composition of pork as influenced by linoleic acid content of the diet. J. Anim. Sci. 70:1397–1403. Lepage, G., and C. C. Roy, 1986. Direct transesterification of all classes of lipids in a one-step reaction. J. Lipid Res. 27:114–120. Leszczynski, D. E., J. Pikul, R. A. Easter, F. K. McKeith, D. G. McLaren, J. Novakofski, P. J. Bechtel, and D. E. Jewell, 1992. Characterization of lipid in loin and bacon from finishing pigs fed full-fat soybeans or tallow. J. Anim. Sci. 70:2175– 2181. Pinchasov, Y., and I. Nir, 1992. Effect of dietary polyunsaturated fatty acid concentration on performance, fat deposition and carcass fatty acid composition in broiler chickens. Poultry Sci. 71:1504–1512. Roessler, E. B., R. M. Pangborn, J. L. Sidel, and H. Stone, 1978. Expanded statistical tables for estimating significance in paired-preference, paired difference, duo-trio and triangle tests. J. Food Sci. 43:940–941. Sales, J., 1998. Fatty acid composition and cholesterol content of different ostrich muscles. Meat Sci. 49:489–492. Sales, J., and J. Horbanczuk, 1998. Ratite meat. World’s Poult. Sci. J. 54:59–67. Salmon, R. E., 1968. Soybean versus rapeseed oil in turkey starter diet. Poultry Sci. 48:87–93. Salmon, R. E., and J. B. O’Neil, 1973. The effect of the level and source of a change of source of dietary fat on the fatty acid composition of the depot fat and the thigh and breast meat of turkeys as related to age. Poultry Sci. 52:302–314. SAS, 1994. SAS/STAT威 Users Guide. Version 6. 4th Edition. SAS Inst. Inc., Cary, NC. Sim, J. S., D. B. Bragg, and G. C. Hodgson, 1973. Effect of dietary animal tallow and vegetable oil on fatty acid composition of egg yolk, adipose tissue and liver of laying hens. Poultry Sci. 52:51–57. Spritz, N., and M. A. Mishkel, 1969. Effects of dietary fats on plasma lipids and lipoproteins: an hypothesis for the lipidlowering effect of unsaturated fatty acids. J. Clin. Invest. 48:78–86. Walsh, L. S., K. D. Wiggers, M. J. Richard, and N. L. Jacobson, 1983. Effect of soy versus beef diets on blood and tissue cholesterol and body composition of growing swine. Nutr. Res. 3:557–569. Wasserman, A. E., 1979. Chemical basis for meat flavor: A review. J. Food Sci. 44:6–11. Wiggers, K. D., K. K. Miller, M. J. Richard, J. W. Stewart, and N. L. Jacobson, 1980. Effect of beef- and soy-based diets on cholesterol disposition in swine. Fed. Proc. 39:336.
