Stat 402A Exam 2 March 29, 2002
advertisement

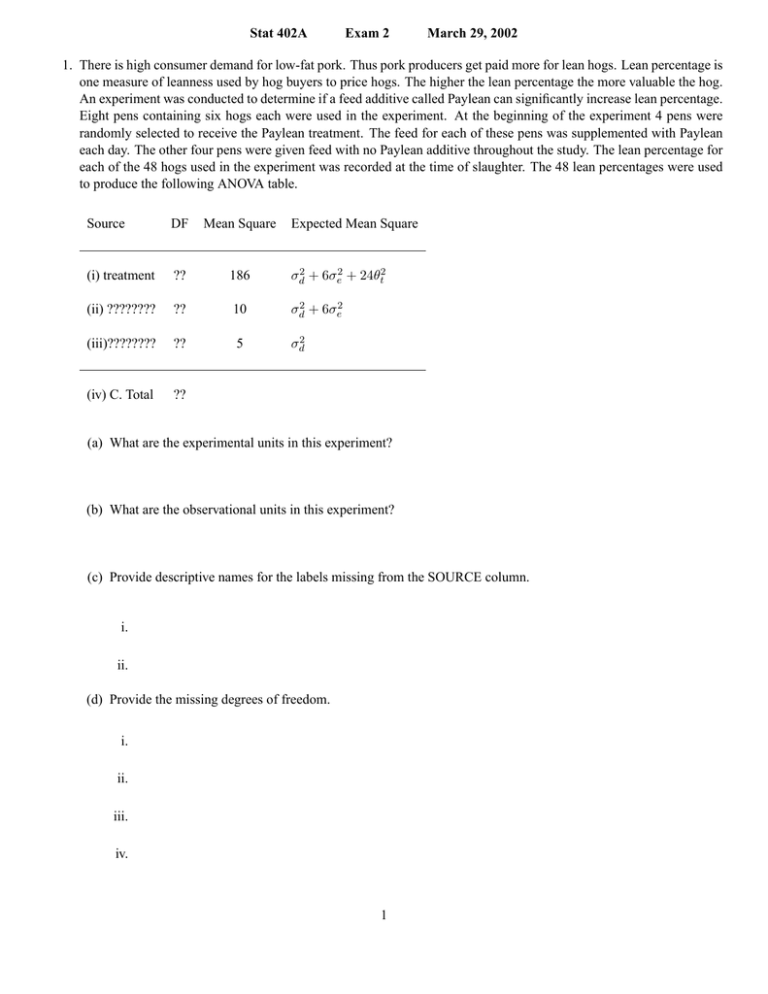
Stat 402A Exam 2 March 29, 2002 1. There is high consumer demand for low-fat pork. Thus pork producers get paid more for lean hogs. Lean percentage is one measure of leanness used by hog buyers to price hogs. The higher the lean percentage the more valuable the hog. An experiment was conducted to determine if a feed additive called Paylean can significantly increase lean percentage. Eight pens containing six hogs each were used in the experiment. At the beginning of the experiment 4 pens were randomly selected to receive the Paylean treatment. The feed for each of these pens was supplemented with Paylean each day. The other four pens were given feed with no Paylean additive throughout the study. The lean percentage for each of the 48 hogs used in the experiment was recorded at the time of slaughter. The 48 lean percentages were used to produce the following ANOVA table. Source DF Mean Square Expected Mean Square (i) treatment ?? 186 σd2 + 6σe2 + 24θt2 (ii) ???????? ?? 10 σd2 + 6σe2 (iii)???????? ?? 5 σd2 (iv) C. Total ?? (a) What are the experimental units in this experiment? (b) What are the observational units in this experiment? (c) Provide descriptive names for the labels missing from the SOURCE column. i. ii. (d) Provide the missing degrees of freedom. i. ii. iii. iv. 1 (e) The average lean percentage of hogs in pens that received the Paylean additive was higher than the average lean percentage of hogs from the other pens. Is there evidence that the observed difference is statistically significant? Conduct a test to answer this question. i. Compute a test statistic. ii. Give the degrees of freedom associated with the test statistic. iii. Write down a relevant value from the appropriate table. iv. Provide a short conclusion. (One sentence will do.) (f) Estimate the variance among lean percentages of hogs within a pen. (g) Estimate the variance component associated with variation among pens treated alike. 2. Prolonged storage can lower the quality of grain. An experiment was conducted to gauge the effect of three factors on the quality of grain stored for 24 months. The three factors considered were preservative (present vs. absent), storage temperature (20◦ vs. 30◦ C), and humidity (low vs. high). Three containers of grain were randomly assigned to each combination of the levels of the three factors. Each container was independently treated with its assigned combination. One grain quality score was obtained for each container. SAS code and output for the analysis of the data are provided at the bottom of this page and continued on to the top of the next. proc glm; class p h t; model y=p h t p*h p*t h*t p*h*t; lsmeans p*h*t / slice=h*t; run; The GLM Procedure Dependent Variable: y Source Model Error Corrected Total DF 7 16 23 Sum of Squares 13187.24580 733.33392 13920.57972 2 Mean Square 1883.89226 45.83337 F Value 41.10 Pr > F <.0001 Source p h t p*h p*t h*t p*h*t DF 1 1 1 1 1 1 1 Type I SS 3617.355162 4552.797966 1746.559636 1363.913032 1276.097257 386.408517 244.114232 Mean Square 3617.355162 4552.797966 1746.559636 1363.913032 1276.097257 386.408517 244.114232 F Value 78.92 99.33 38.11 29.76 27.84 8.43 5.33 Pr > F <.0001 <.0001 <.0001 <.0001 <.0001 0.0104 0.0347 Least Squares Means p absent absent absent absent present present present present h high high low low high high low low t 20 30 20 30 20 30 20 30 y LSMEAN 55.2 9.2 83.4 66.2 73.9 69.7 84.7 83.9 The researchers already know a lot about the effects of temperature and humidity on grain quality from past research. This experiment was conducted primarily to understand the effects of the preservative on grain quality at differing combinations of temperature and humidity. Conduct appropriate analyses and briefly summarize the results of your analyses to help the researchers understand how the preservative effects grain quality. 3 3. Recall the paper airplane experiment conducted in class earlier this semester. We were interested in the effect of two factors on flight distance of paper airplanes. The factors were plane type (Dart vs. Flyer) and thrower which had 27 levels – one for each of the 27 students that participated in the experiment. Each student made and flew two planes of each type. The experiment was conducted in a completely randomized manner. SAS code and output are provided below. proc glm; class plane thrower; model distance=plane thrower plane*thrower; run; The GLM Procedure Dependent Variable: distance Source Model Error Corrected Total Source plane thrower plane*thrower DF 53 54 107 Sum of Squares 3464.289673 2045.552083 5509.841757 Mean Square 65.363956 37.880594 F Value 1.73 Pr > F 0.0241 DF 1 26 26 Type I SS 98.072595 1841.583076 1524.634002 Mean Square 98.072595 70.830118 58.639769 F Value 2.59 1.87 1.55 Pr > F 0.1134 0.0264 0.0879 One of the students in our Stat 402 class suggested that there might have been a significant difference between the mean flight distance of planes thrown by women and the mean flight distance of planes thrown by men. The average flight distance of planes thrown by the 13 male participants was 22.43 feet. The average flight distance of planes thrown by the 14 female participants was 20.60 feet. Is this difference statistically significant? Support your answer with an appropriate statistical analysis. 4


