An Analysis Using the Log Transformation
advertisement
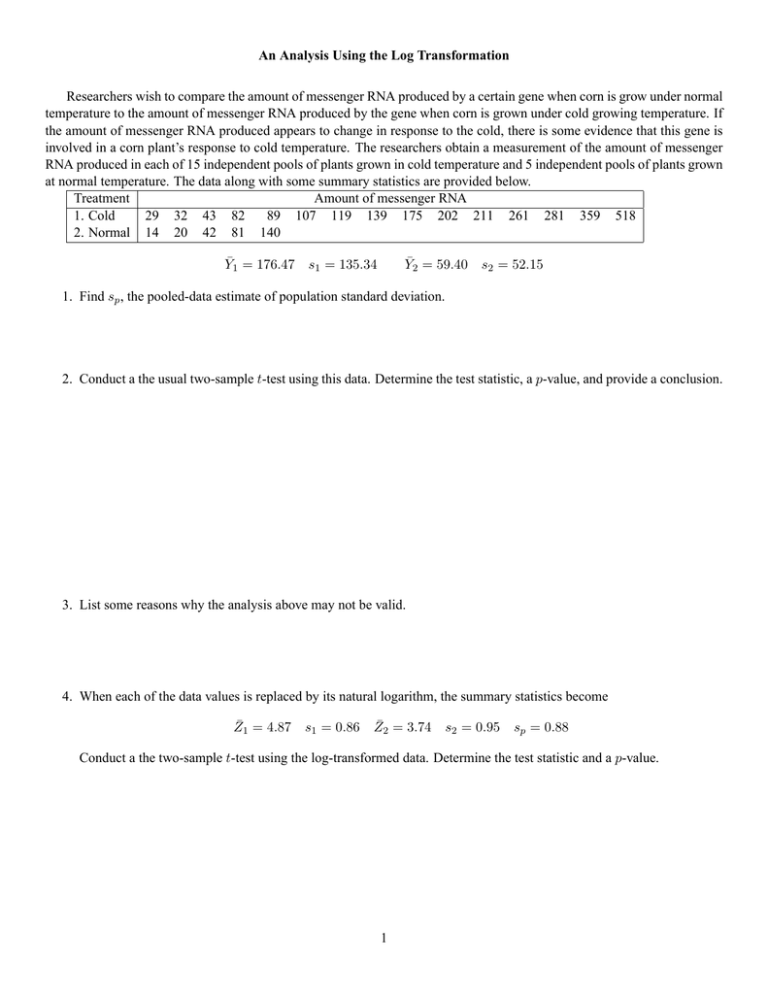
An Analysis Using the Log Transformation Researchers wish to compare the amount of messenger RNA produced by a certain gene when corn is grow under normal temperature to the amount of messenger RNA produced by the gene when corn is grown under cold growing temperature. If the amount of messenger RNA produced appears to change in response to the cold, there is some evidence that this gene is involved in a corn plant’s response to cold temperature. The researchers obtain a measurement of the amount of messenger RNA produced in each of 15 independent pools of plants grown in cold temperature and 5 independent pools of plants grown at normal temperature. The data along with some summary statistics are provided below. Treatment Amount of messenger RNA 1. Cold 29 32 43 82 89 107 119 139 175 202 211 261 281 359 518 2. Normal 14 20 42 81 140 Ȳ1 = 176.47 s1 = 135.34 Ȳ2 = 59.40 s2 = 52.15 1. Find sp , the pooled-data estimate of population standard deviation. 2. Conduct a the usual two-sample t-test using this data. Determine the test statistic, a p-value, and provide a conclusion. 3. List some reasons why the analysis above may not be valid. 4. When each of the data values is replaced by its natural logarithm, the summary statistics become Z̄1 = 4.87 s1 = 0.86 Z̄2 = 3.74 s2 = 0.95 sp = 0.88 Conduct a the two-sample t-test using the log-transformed data. Determine the test statistic and a p-value. 1 5. What does Z̄1 = 4.87 estimate? 6. What does eZ̄1 = e4.87 = 130.32 estimate? 7. What does Z̄1 − Z̄2 = 4.87 − 3.74 = 1.13 estimate? 8. What does eZ̄1 −Z̄2 = e4.87−3.74 = e1.13 ≈ 3.10 estimate? (Hint: elog(a)−log(b) = ab ) 9. Find a 95% confidence interval for the difference between the mean of the log messenger RNA amount produced by the corn gene under cold growing temperature and the mean of the log messenger RNA amount produced by the corn gene under normal growing temperature. 10. Provide a clear statement that explains the results of the these analyses. 2
