Document 10639451
advertisement

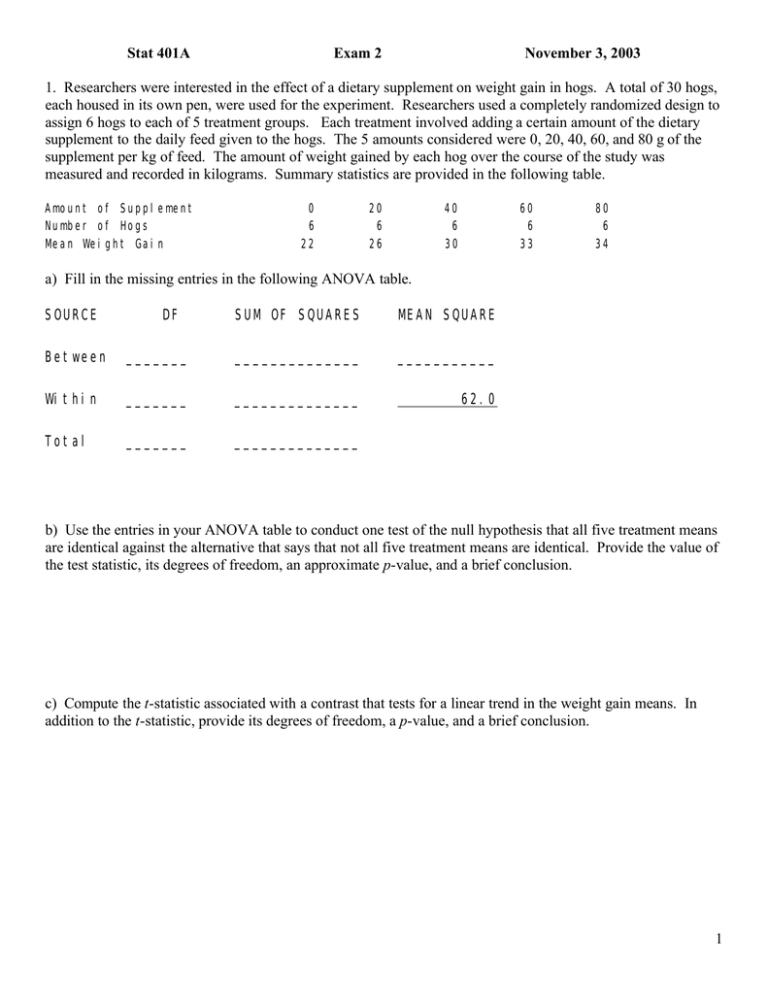
Stat 401A Exam 2 November 3, 2003 1. Researchers were interested in the effect of a dietary supplement on weight gain in hogs. A total of 30 hogs, each housed in its own pen, were used for the experiment. Researchers used a completely randomized design to assign 6 hogs to each of 5 treatment groups. Each treatment involved adding a certain amount of the dietary supplement to the daily feed given to the hogs. The 5 amounts considered were 0, 20, 40, 60, and 80 g of the supplement per kg of feed. The amount of weight gained by each hog over the course of the study was measured and recorded in kilograms. Summary statistics are provided in the following table. Amount of Supplement Number of Hogs Mean Weight Gain 0 6 22 20 6 26 40 6 30 60 6 33 80 6 34 a) Fill in the missing entries in the following ANOVA table. SOURCE DF SUM OF SQUARES MEAN SQUARE Between _______ ______________ ___________ Within _______ ______________ 62.0 Total _______ ______________ b) Use the entries in your ANOVA table to conduct one test of the null hypothesis that all five treatment means are identical against the alternative that says that not all five treatment means are identical. Provide the value of the test statistic, its degrees of freedom, an approximate p-value, and a brief conclusion. c) Compute the t-statistic associated with a contrast that tests for a linear trend in the weight gain means. In addition to the t-statistic, provide its degrees of freedom, a p-value, and a brief conclusion. 1 2. The data in problem 1 can be viewed as 30 pairs of values (X1,Y 1), (X2,Y2), ..., (X30,Y 30) where X i denotes the amount of the supplement that was added to the ith hog's diet and Y i denotes the weight gain of the ith hog. a) Determine the standard deviation of the 30 X values (s x) and the standard deviation of the 30 Y values (sy). (These standard deviations are needed to complete other parts of this problem. If you cannot compute these standard deviations from the information given, please use sx = 35 and sy = 10 when completing other parts of this problem. You will get full credit for all other parts that are done correctly using the incorrect values sx = 35 and sy = 10.) b) The sample linear correlation coefficient between weight gain and the amount of supplement is 0.518. Find the equation of the least-squares regression line for estimating the mean weight gain of a hog as a function of the amount of supplement added to the diet. c) Estimate the mean weight gain of hogs whose diets are supplemented with 50 g of the supplement per kg of feed. d) Estimate the standard deviation of weight gains of hogs whose diets are supplemented with 50 g of the supplement per kg of feed. 2 e) Determine the standard error of your estimate of the mean weight gain of hogs whose diets are supplemented with 50 g of the supplement per kg of feed. f) Provide a 95% confidence interval for your estimate of the mean weight gain of hogs whose diets are supplemented with 50 g of the supplement per kg of feed. g) Fill in the entries in the following ANOVA table. SOURCE DF SUM OF SQUARES MEAN SQUARE Regression _______ ______________ ___________ Error _______ ______________ ___________ Total _______ ______________ F ________ P-VALUE _______ h) Write down the null and alternative hypotheses associated with the test whose p-value was computed as part of the ANOVA table in part (g). 3. An experiment was conducted to compare soybean yields of plots treated with one of three herbicides (A, B, or C) or a control (D) . A total of 32 soybean plots were used in the experiment; 8 plots were randomly assigned to each of the four treatments. Statistics summarizing the yields in bushels per acre are provided in the following table. Treatment A B C D Number of Plots 8 8 8 8 Mean Yield 60.3 62.1 57.6 52.0 Variance of Plot Yields (SD2) 9.8 10.1 9.2 9.7 3 a) Find a 95% confidence interval for the average of the three herbicide means minus the control mean. b) Suppose we want to test for differences between all pairs of treatment means while keeping the probability of one or more mistaken rejections of a true null hypothesis below 0.05. The minimum significant difference associated with the Tukey method for all pairwise comparisons among four means is about 4.2 bushels per acre for this data (i.e., HSD=4.2). Use this information to construct a line plot that illustrates which treatment means are significantly different from one another. c) Based on the line plot constructed in part (b) state whether each of the following statements is true or false. We can be at least 95% confident that... (i) treatment B has the highest mean yield of the four treatments __________ (ii) either treatment A or B has the highest yield of the four treatments __________ (iii) all three herbicides have a higher mean yield than the control __________ (iv) treatment A may have the lowest mean yield of the three herbicide treatments __________ 4
