Statistics 503 Homework 1
advertisement
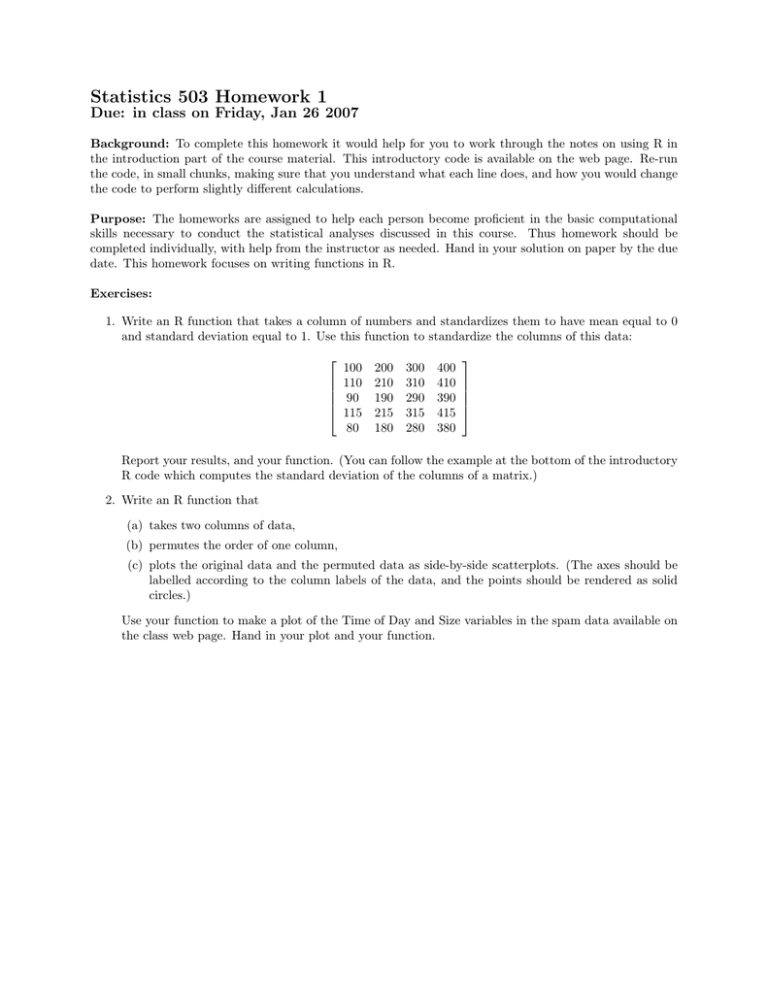
Statistics 503 Homework 1 Due: in class on Friday, Jan 26 2007 Background: To complete this homework it would help for you to work through the notes on using R in the introduction part of the course material. This introductory code is available on the web page. Re-run the code, in small chunks, making sure that you understand what each line does, and how you would change the code to perform slightly different calculations. Purpose: The homeworks are assigned to help each person become proficient in the basic computational skills necessary to conduct the statistical analyses discussed in this course. Thus homework should be completed individually, with help from the instructor as needed. Hand in your solution on paper by the due date. This homework focuses on writing functions in R. Exercises: 1. Write an R function that takes a column of numbers and standardizes them to have mean equal to 0 and standard deviation equal to 1. Use this function to standardize the columns of this data: 100 110 90 115 80 200 300 400 210 310 410 190 290 390 215 315 415 180 280 380 Report your results, and your function. (You can follow the example at the bottom of the introductory R code which computes the standard deviation of the columns of a matrix.) 2. Write an R function that (a) takes two columns of data, (b) permutes the order of one column, (c) plots the original data and the permuted data as side-by-side scatterplots. (The axes should be labelled according to the column labels of the data, and the points should be rendered as solid circles.) Use your function to make a plot of the Time of Day and Size variables in the spam data available on the class web page. Hand in your plot and your function.
