Local flame structure analysis of stratified V-shaped flame by Rayleigh... PLIF on acetone
advertisement
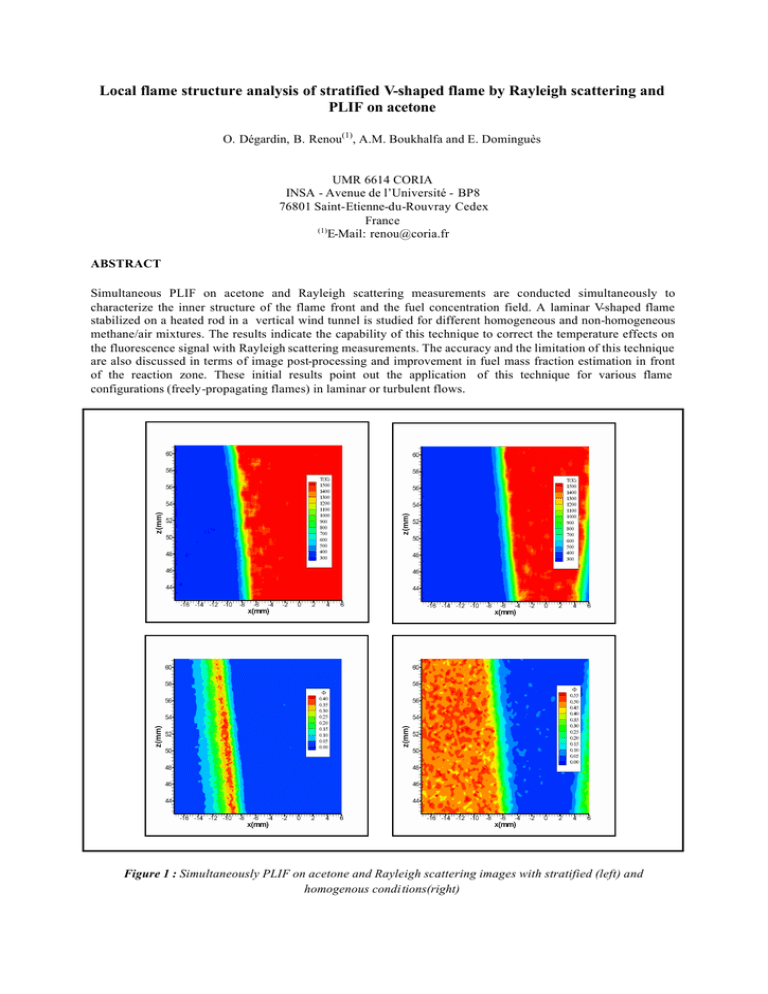
Local flame structure analysis of stratified V-shaped flame by Rayleigh scattering and PLIF on acetone O. Dégardin, B. Renou(1), A.M. Boukhalfa and E. Dominguès UMR 6614 CORIA INSA - Avenue de l’Université - BP8 76801 Saint-Etienne-du-Rouvray Cedex France (1) E-Mail: renou@coria.fr ABSTRACT Simultaneous PLIF on acetone and Rayleigh scattering measurements are conducted simultaneously to characterize the inner structure of the flame front and the fuel concentration field. A laminar V-shaped flame stabilized on a heated rod in a vertical wind tunnel is studied for different homogeneous and non-homogeneous methane/air mixtures. The results indicate the capability of this technique to correct the temperature effects on the fluorescence signal with Rayleigh scattering measurements. The accuracy and the limitation of this technique are also discussed in terms of image post-processing and improvement in fuel mass fraction estimation in front of the reaction zone. These initial results point out the application of this technique for various flame configurations (freely-propagating flames) in laminar or turbulent flows. Figure 1 : Simultaneously PLIF on acetone and Rayleigh scattering images with stratified (left) and homogenous conditions(right) 1. INTRODUCTION In many industrial configurations, combustion occurs in turbulent flows where fuel and oxidizer are not homogeneously mixed. Consequently, the chemical reactions mainly occur in a mixture where the equivalence ratio distribution is heterogeneous or stratified. Combustion conditions are thus different from classical premixed or non-premixed strategies. In new car engines (Gasoline Direct-Injection engines for example), it has been shown that ‘clean’ combustion can be obtained by lean burning in a stratified charge, while still maintaining good performances (ZHAO et al., 1999). Combustion conditions are then different from classical premixed or non-premixed strategies. In perfectly premixed combustion, the flame front can be des cribed using the progress variable c based either on temperature or species mass fractions. The introduction of equivalence ratio gradients in a premixed flow requires the knowledge of another parameter : the local composition of the medium. In nonpremixed combustion, this is the role of the mixture fraction Z. Stratified combustion, or more generally heterogeneous combustion is halfway between those two ideal cases. Previous numerical and experimental studies have underlined that the main effects of stratification (or local equivalence ratio gradient) concerns the flame speed, the flame thickness and the burnt gas temperature (POINSOT et al., 1996 ; RENOU et al., 2004). Indeed, local heterogeneities or local equivalence ratio gradients produce temperature and radical diffusion fluxes in the reaction zone and may strongly modify the reaction rate. In order to point out these effects, an experimental set-up has been developed and adapted for stationary and freely -propagating flames, in a medium where the mixt ure fraction heterogeneities are perfectly controlled. In this paper, the flame structure is characterized by using simultaneously PLIF on acetone and Rayleigh scattering in a laminar V-Shaped flame. The paper is organized as follow : after presenting the experimental set-up, simultaneous measurements of PLIF and Rayleigh scattering are discussed. The limitations and the assumptions of the technique are also presented. The temperature field and the equivalence ratio field are further characterized in homogeneous and stratified flames. Conclusions are finally drawn. 2. EXPERIMENTAL SET-UP The experimental set-up (Figure 1) consists of a vertical wind tunnel adapted to stationary and non-stationary combustion (RENOU et al., 2003 ; RENOU et al., 2004) with a mean flow velocity of 4m/s. An upstream ‘mixing chamber’ composed of 9 parallel vertical compartments, enables various equivalence ratio profiles to be obtained. Different stratified conditions are investigated to characterize the influence of equivalence ratio φ gradients in the laminar flow. The flame is stabilized on the heated rod situated on the central axis (x=0), for a stoeichiometric equivalence ratio. Then, various decreasing equivalence ratio profiles are produced thanks to the injection and mixing chamber (Figure 3). Those cases are compared with homogeneous cases. Homogeneous mixtures are produced before the main flow inlet (Figure 2). The initial conditions are then referenced in terms of initial amplitude equivalence ration and mixture fraction, ∆Φini and ∆Ζini , and are summarized in Table 1. φ ∆φini ∆Zini 1→0 1 0.06 1→0.7 0.3 0.0172 0.5 0 0 Table 1 : Experimental conditions summary Study zone Convergent Injection and Mixing chamber Divergent Metrological Air Figure 2 : Schematic of the vertical wind tunnel. Figure 3 : Typical profile of equivalence ratio within the study zone ?F (1-0). The flame temperature field is obtained by Rayleigh scattering method (DIBBLE and HOLLENBACH, 1981 ; FOURGETTE et al, 1986 ; MANSOUR,1993 ; O’YOUNG and BILGER, 1996,1997 ). The apparatus consists of a frequency doubled Nd-YAG laser with a typical energy of 400mJ/pulse. Two 20 mm and 200 mm focal length cylindrical lenses and a 1000 mm focal length spherical lens enable a laser sheet to be obtained with constant thickness and height on the study zone. The laser sheet property (thickness and shape) characterization is carried out by using CCD camera (WincamD 14 bits). The laser sheet thickness if found to be constant and equal to 100 µm in the study zone. Rayleigh scattering flame images are recorded with 50 mm Nikkon lens (f:1/1.2) on an intensify CCD camera (Princeton Instruments, 16 bits), with a CCD array of 512×512 pixels 2 and a magnification ratio of 9.6 pixels.mm-1 . The intensifier is gated at 100 ns, necessary to fully capture the whole laser pulse of 8 ns, but short enough to suppress most of the flame luminescence. The fuel concentration is obtained by P.L.I.F on Acetone technique. The apparatus consists of a frequency quadrupled Nd-YAG laser with a typical energy of 70 mJ/pulse. PLIF images are recorded with 50 mm Nikkon lens (f:1/1.2) on an intensify CCD camera (Lavision Flamestar, 14 bits), with a CCD array of 384x286 pixels 2 and a magnification ratio of 10.2 pixels.mm-1 . The intensifier is also gated at 100 ns. The signal is filtered by a 532 nm rejection filter in order to suppress the Rayleigh scattering signal and his background reflections. The fuel is seeded with acetone by bubbling methane through the Acetone tank which is plunged in a water tank. The effects of laser sheet attenuation and the modification of methane/air combustion kinetics are minimized by using a low acetone concentration (5% in volume) in methane. Figure 4 : The optical set-up used for the simultaneous PLIF and Rayleigh scattering showing the angle between the both camera. Figure 4 depicts the experimental arrangement used for PLIF and Rayleigh scattering measurements. In order to decrease the reflection noise level, both cameras have been situated on the same side of the las er sheets. The ICCD camera for Rayleigh scattering is situated in the direction normal to the laser sheet, whereas the ICCD camera for PLIF is shifted with an angle of viewing α of 6° (Figure 4). To reduce the limited depth of field the Nikkor lens is used with a Scheimpflug mount. Unfortunately, this arrangement has the side effect of introducing a strong perspective distortion characterized by a non constant factor of magnification across the complete field of view. To correct this distortion effect, a mapping function approximated by a 2D-polynomial of third order has been used. A third-order polynomial is usually sufficient for classical experimental conditions with deviations up to 45° degrees from the normal, but especially for cylindrical distortions. Such a mapping function can quickly show its limits and then the 2D-polynomial may not reflect the true distortion sufficiently. For that the angle between the both camera have to be small as much as possible in order to try to minimize the distortion. Figure 5 shows images before and after correction to the distortion. The both patterns of the two camera fields are superimpose in order to have the same reference scale. Initial image Corrected image by a mapping function Figure 5 : Image correction to distortion applied to the pattern 3. SIMULTANEOUS TEMPERATURE AND FUEL MASS FRACTION MEASUREMENT 3.1. Acetone PLIF For weak excitation, the fluorescence signal SF from acetone molecule is given by [THURBER, 1999] : χ ( x, y) P σ(λ , T) Ψ λ, T, P, χ S F (x , y ) = I 0 (x , y , λ ) dVc ηopt Acetone ∑ i kT i (1) where, I0 (?) is the local laser energy density in the detection volume dVc [cm3 ], ? opt is the overall efficiency of the collection optics. The bracketed term is the acetone number density [cm-3 ], given as the product of mole fraction ?Acetone and total pressure P divided by the Boltzmann constant k times temperature T. The final two quantities are s, the molecular absorption cross-section of the tracer [cm2 ], and ? the fluorescence quantum yield. The effect of composition variation on fluorescence quantum yield can be neglected [THURBER and HANSON, 1998] and the fluorescence signal becomes for constant pressure and for a fixed wavelength excitation : χ ( x,y) S F ( x,y ) = C 0 ( x,y) Acetone σ A ( λ , T ) Ψ ( λ, T ) T(x,y) (2) S F ( x,y ) = C 0 ( x,y) χ Acetone ( x , y) f ( λ ,T ) where f (λ, T ) = σ A (λ , T ) Ψ(λ , T ) T (x , y ) Based on an experimental study at atmospheric pressure, Thurber et al. [THURBER et al., 1998] have evaluated the temperature influence on the different terms of this function f (λ , T ) for five different high-pulse-energy UV laser wavelengths. The absorption cross section σA (λ, T ) increases with increasing temperature whatever the wavelengths, but changing only slightly with temperature at the shorter wavelength. It appears that the absorption cross-section can be considered as independent of temperature for ?=266 nm. For all wavelengths the fluorescence yield decreases strongly with increasing temperature. Tabulated values of the ratio f (λ, T ) f (λ , T0 ) have been reported [THURBER and HANSON 2001] and indicate how the temperature affects the fluorescence signal per unit mo le fraction (Figure 6). Figure 6 : Temperature influence on the fluorescence signal per unit of acetone mole fraction, at atmospheric pressure for λ=266nm [THURBER and HANSON, 2001]. 3.2. Rayleigh scattering technique The main principle of the Rayleigh scattering is an elastic interaction between an incident laser light and gas molecule (PITTS and KASHIWAGI, 1984). For a gas with various components, the Rayleigh scattering signal is given by : ∂σ SR ( x,y ) = I 0 ( x,y, λ ) .C.N(x,y). 1 ∑i χi ( x , y) ∂Ω i (3) where I0 (?) is the incident laser light intensity. C0 is the system calibration constant which accounts for the optical collection efficiency and characteristics lengths of the laser sheet imaged on the detector. N is the total molecular number density and ?i the mole fraction of the different molecules. ∂ σ represents the Rayleigh ∂Ω i scattering cross section for each different molecules. The Rayleigh cross-section can be expressed as follows : 2 2 ∂σ 4π n i − 1 sin 2 (θ) = 4 ∂ Ω N λ i 0 (4) where n i is the index of refraction of the considered molecule at standard temperature and pressure (STP) conditions. ? is the angle between the incident and the scattering direction and ? the laser wavelength (cm). N0 is the Loschmidt number and represents the medium density at the STP conditions (2.69 1019 cm-3 ). Since (n i -1) is proportional to the local number density, the differential cross section itself is independent of density and temperature. If we assume constant pressure conditions and apply ideal gas law, the total molecular number density as a function of temperature. In such cases, Equation 3 becomes: S R ( x,y ) = C1′ ( x,y ). 1 ∂σ . ∑ χi ( x , y ) T(x,y) i ∂Ω i (5) 3.3. Simultaneous measurements The simultaneous measurement of mixture fraction and temperature field across the flame front is of first importance for many premixed or partially premixed combustion. Indeed, the chemical reactions mainly occur in a mixture where the equivalence ratio distribution is heterogeneous or stratified. The local flame properties, local flame thickness or displacement speed for example, are then strongly influenced by the mixtures characteristics. Using simultaneously PLIF on acetone and Rayleigh scattering allows an accurate estimation of the local flame structure. If we consider these techniques separately for an application of premixed or partially premixed combustion, many drawbacks can be observed : The LIF signal decreases strongly with temperature through the function f(?,T). The distance needed for the temperature to increase from the fresh gases temperature (300K) to the acetone pyrolysis temperature (1000K) may be not negligible, especially for very lean homogeneous or stratified mixtures. Errors in mixture fraction measurements can reach 50% in this zone and initial PLIF measurement must be corrected by the temperature field. If acetone is locally present in the mixture for PLIF acetone measurements, a contribution of Rayleigh scattering on acetone on the temperature field can be observed even if acetone concentration is very low. Acetone molecule scattering is an order of magnitude larger than air molecule scattering since the differential Rayleigh cross-section α Air Ac = ( ∂σ ∂Ω ) Ac − (∂σ ∂Ω )Air is ( ∂σ ∂Ω )Air equal to 12.8 +/- 0.1 for ?=266nm (BRESSON, 2000). This non-dimensional quantity characterizes the amount of acetone Rayleigh scattering added to the initial mixture Rayleigh scattering. If we consider an acetone concentration of 1% in the whole mixture for LIF measurement, the increasing of Rayleigh signal will reach 14% which leads to an error on temperature measurement of 14%. Thus, Rayleigh signals must be corrected by the knowledge of local acetone mole fraction obtained by PLIF on acetone. The measured signal intensity both from Rayleigh scattering and PLIF on acetone have to be corrected from background reflections, dark currents of the ICCD cameras and non-uniformity of laser sheet energy. These corrections are described below. • Rayleigh scattering For lean methane/air mixtures, the Rayleigh scattering cross-section remains constant within 1% in the unburned and burned gases and it will be denoted (∂σ ∂Ω) Mix . When the acetone is added to the mixtures, the Rayleigh signal becomes : S R ( x,y ) = C′1 ( x,y ) . ( 1 . χAc (x,y ) (∂σ ∂Ω )Ac + (1 − χAc (x,y ) ) (∂σ ∂Ω) Mix T(x,y) ) (6) Thus temperature image can be expressed as : T ( x,y ) = ( C′1 ( x,y ) . χ Ac ( x,y ) ( ∂σ ∂Ω ) Ac + ( 1 − χ Ac ( x,y ) ) ( ∂σ ∂Ω ) Mix where C′ = 1 SR ( x,y ) − S N ( x,y ) − Sγ ( x,y ) ) (7) T0 (S (x , y) − S N (x , y) ) ∂σ ∂Ω ( )Mix Air and S ( x,y ) = S (x,y ) − N He (∂σ ∂Ω )He (S ( x,y ) − SHe ( x,y ) ) ( ∂σ ∂Ω)Mix − (∂σ ∂Ω )He Air where S Air and SHe are the measured Rayleigh intensities of the unburned mixture (without acetone) and helium, respectively, at reference temperature T0 which is taken as the room temp erature, 298 K. SN represent the laminar flame chemiluminescence. • Acetone PLIF The PLIF signal is corrected from background noise and non-homogeneity of the laser sheet. Thus, the local mole fraction of acetone is given by : χAc = SF,Corrected ( x,y) SR,Ref. where SF,Corrected ( x,y ) = (8) C′1 ( x,y ) χAc ( x,y) f ( T ) − SF,N ( x,y ) and SF,Ref. is the fluorescence signal of a medium C′1 ( x,y ) χAc,Ref.f ( TRef. ) − SF , N ( x , y) where the acetone mole fraction is perfectly known. An iterative process has to be used to measure simultaneously the local temperature and the fuel mole fraction, and convergence is obtained typically in less than four iterations. . To assume that acetone is a good seeder of methane, acetone and methane must have the same combustion behaviour. In other word, acetone should disappear at the same rate than methane. The decomposition of acetone is different than methane oxidation, especially at high temperature (T > 1000K) when pyrolysis phenomena become non negligible [SATO and HIDAKA, 2000]. Moreover, the fluorescence signal to noise ration strongly decreases with temperature, and the accuracy on the corrected value of fuel mass fraction decreases. In such conditions, the correction of fluorescence signal is stopped at T=500 K. 4. RESULTS 4.1 Homogenous flame From the equivalence ratio and temperature fields represented bellow in figure 7, different profiles can be extracted according to the normal to flame front. Figure 7 : Simultaneous equivalence ratio and temperature map with homogenous condition F=0.5 . Both signals present fluctuations, both in the fresh gases for PLIF and in the burnt gases for Rayleigh scattering. In the case of PLIF measurements, acetone was seeding in very low concentration (5 % mole fraction in the methane or 0.1 % mole fraction in the whole mixture) in order to minimize its effect on combustion behaviour. Consequently, the fluorescence signal is quite low and presents a signal to noise ratio of 3. For Rayleigh scattering, the photocathode of the intensify camera is not optimized for the Nd:YAG laser wavelength (quantum efficiency of 12%) and the Rayleigh signal in the burnt gases is similar to the noise. An improvement of the measurements will be performed in next months by using new photocathode (UNIGEN) with a quantum efficiency of 40% at 532 nm.. We also observe a decreasing of equivalence ratio with temperature. This decreasing can be explained simultaneously the natural decomposition of acetone by oxidation and pyrolysis [SATO and HIDAKA, 2000] and by the decaying of the fluorescence signal with temperature. The second phenomenon can be corrected according to the theoretical analysis described above and results are shown on figure 8. On the right side of the figure 8, a zoom has been done near the flame front in order to see the influence of the correction on the fluorescence signal. 1600 0.55 0.50 1600 0.50 0.45 0.45 1400 1400 0.40 1200 0.40 1200 0.35 0.20 1000 0.30 Φ ΦΝ Τ (Κ) Τ (Κ)Ν 0.25 800 0.20 600 0.15 0.10 800 600 0.15 0.10 400 0.05 T (K) Φ ΦΝ Τ(Κ) Τ(Κ)Ν 0.25 Φ 1000 0.30 T (K) Φ 0.35 400 0.05 -16 -14 - 12 -10 - 8 -6 -4 -2 0 2 4 6 200 8 -8 x(mm) -7 -6 -5 -4 x(mm) Figure 8 : Fluorescence signals and Temperature in case of homogenous condition F=0.5 Simultaneously, the temperature signal can be corrected according Eq. 7. Indeed, the polyatomic molecule of acetone diffuses more light than air (~x14). This phenomenon can not be neglected. An acetone seeding of 1 % induces a cross section increasing of 14 % which leads to an uncertainly on the temperature measurements of 14 %. In our case, the flow is seeded with 0.1 % of acetone, which leads to a maximum increasing of temperature of 1%, as we can see in the figures 8 and 9. 0.55 400 0.45 0.50 400 0.40 375 0.45 0.35 0.40 350 350 300 0.20 0.15 0.10 275 Φ ΦΝ Τ (Κ) Τ (Κ)Ν 0.25 Φ Φ 0.25 T (K) 325 0.30 300 0.20 0.15 Φ ΦΝ Τ(Κ) Τ(Κ) Ν 0.10 250 0.05 0.05 250 225 - 16 -15 - 14 -13 - 12 -11 - 10 x(mm) -9 -8 -7 -6 -5 - 12 -10 -8 x(mm) Figure 9 : Equivalence ratio and temperature profiles in stratified and homogenous conditions. T (K) 0.30 0.35 4.1 Stratified flame Like the homogenous condition, equivalence ratio and temperature are represented bellow on figure 9 and similar comments can be done on the fluorescence signal and temperature correction of stratified flames. As we can see in the figures 10 and 11, the temperature curve slope can be divided in two parts. The first part with the highest slope corresponds to the reaction zone and the second part with the lowest slope corresponds to the burnt gas temperature of a richer combustion (equivalence ratio fixed to unity in the initial conditions), which takes place near the heated rod, 50 mm below. This strong gradient of equivalence ratio produces high thermal diffusion fluxes which sustain the combustion phenomena, and allows the flame propagation with typical local equivalence ratio below the flammability limits [RA, 1999 ; PIRES DA CRUZ, 2000]. Figure 10 : Simultaneous equivalence ratio and temperature map with ?F(1-0) gradient. Second part First part 0.45 1800 1800 0.40 0.40 1600 1600 0.35 0.35 1400 1400 0.30 0.30 1200 1000 T(K) 0.25 Φ 1000 0.20 1200 T (K) Φ 0.25 0.20 800 Φ ΦΝ Τ(Κ) 0.15 0.10 800 Φ ΦΝ Τ(Κ) 0.15 600 600 0.10 400 0.05 400 0.05 200 -16 -14 - 12 -10 -8 -6 -4 X(mm) -2 0 2 4 6 200 -10 -8 X(mm) -6 Figure 11 : Fluorescence signals and Temperature in case of stratified charge ?F(1-0) gradient 3. Numerical contribution In the figures 12 and 13, the gain ∆Φ/Φ and ∆Τ/Τ obtained by numerical correction are represented for both conditions. As we can observe, the gain ∆Φ/Φ can reach up to 45 % at T=500 K and allow the mixture fraction (rather than the equivalence ratio) to be measured at the beginning of the oxidation phenomena. This result shows the importance of temperature influence on the fluorescence signal and demonstrates the interest to integrate the temperature in PLIF on acetone measurements in reacting flow. Nevertheless this method is limited for temperature lower than 500 K. It is admitted that Rayleigh scattering temperature uncertainties are typically closed to 10 % [DINKELACKER, 1998]. Introducing low acetone concentration in the mixture do not modify the accuracy of the technique, as we can see in figure 12. ∆Τ/Τ can reach a maximum of 1% in both cases and represents the maximum error due to acetone. Because the fluorescence signal correction depends on temperature, the fluorescence signal correction accuracy is closed to 10 %. T>500 K T>500 K 0.70 ∆Φ /Φ Φ ΦΝ Τ( Κ) Τ( Κ)Ν 0.60 1400 1300 1500 0.50 1200 0.50 1100 ∆Φ/Φ 800 0.30 T (K) 900 0.30 1000 ∆Φ /Φ Φ ΦΝ Τ( Κ) Τ( Κ)Ν 700 0.20 0.20 600 500 0.10 0.10 400 T (K) 0.40 1000 0.40 ∆Φ/Φ 0.60 500 300 0.00 0.00 - 7.5 - 7.0 - 6.5 - 6.0 - 5.5 - 5.0 - 4.5 - 12.5 - 12.0 - 11.5 -11.0 -10.5 -10.0 -9.5 x(mm) -9.0 -8.5 -8.0 x(mm) Figure 12 : Fluorescence signals with the gain ∆Φ/Φ in stratified and homogenous conditions. 0.012 400 0.012 0.011 400 0.011 0.010 0.010 0.009 350 0.007 0.007 Τ(Κ) 0.006 300 0.005 0.004 350 ∆Τ/Τ 0.008 ∆Τ/Τ 0.008 Τ(Κ) 0.009 0.006 300 0.005 0.004 ∆Τ/Τ Τ(Κ) Τ(Κ)Ν 0.003 0.002 ∆Τ/Τ Τ(Κ) Τ(Κ)Ν 0.003 250 0.001 0.002 250 0.001 - 16 -15 - 14 -13 - 12 -11 - 10 x(mm) -9 -8 -7 -6 -5 -16 -15 -14 -13 -12 -11 -10 -9 x(mm) Figure 13: Temperature signals with the gain ∆Τ/Τ in stratified and homogenous conditions. CONCLUSION Experimental measurements have been carried out on laminar flames stabilized on a heated rod in a stratified or homogenous fuel/air mixture configurations. PLIF on Acetone and Rayleigh scattering techniques have been performed simultaneously to measure flame temperature and fuel mass fraction in front of the flame. The PLIF signal can be corrected by the Rayleigh scattering measurements and we can brought an increasing resolution (up to 45 %) of the equivalence ratio (or fuel mass fraction) behind the flame front. These are preliminary results and other conditions (various fuel/air mixing profiles, freely-propagating conditions) will be investigated. The acetone oxidation and pyrolysis phenomena at low temperature will be also numerically explored and will brought a new comprehension of the flame behaviour. REFERENCES [1] BRESSON A, PhD thesis report, University of Rouen, France ,2000. [2] DIBBLE R. W. and HOLLENBACH R. E., Laser Rayleigh Thermometry in Turbulent Flames, eighth Symposium on Combustion, The Combustion institute, pp 1489-1499, 1981. [3] DINKELACKER F., SOIKA A., MOST D., HOFMANN, LEIPERTZ A., POLIFKE W. and DOBBELING K., Structure of Locally Quenched Highly Turbulent Lean Premixed Flames, Twenty-seventh Symposium on Combustion, The Combustion institute, pp 857-865, 1998. [4] ECBRETH A.C., Laser Diagnostics for Combustion Temperature and Species. Tunbridge Wells, Abacus Press., 1988. [5] FOURGUETTE D. C., ZURN R. M. and M. B. LONG, Two-Dimensional Rayleigh Thermometry in a Turbulent Nonpremixed Methane-Hydrogen Flame, Combustion Science and Technology, 44:307-317, 1986. [6] FOURGUETTE D.C., ZURN R. M. and LONG M.B., Two-Dimensional Rayleigh Thermometry in a Turbulent Nonpremixed Methane-Hydrogen Flame, Combustion Science and Technology, 44:307-317, 1986. [7] LAUFER G, McKENZIE R.L., FLETCHER D.G., Method for measuring Temperatures and Densities in Hypersonic Wind Tunnel Air Flows Using Laser Induced O2 Fluorescence, Applied Optics, 29:4873-4883, 1990. [8] LOZANO A, YIP B. and HASON R. K., Acetone: a Tracer for Concentration Measurements in Gaseous Flows by Planar Laser-Induced Fluorescence. Experiments In Fluids, 13: 369-376, 1992. [9] MANSOUR M.S., Two-Plane Two-Dimensional Rayleigh Thermometry Technique for Turbulent Combustion, Optics Letters, 18(7):537-539, 1993. [10] O’YOUNG F. and BILGER R. W., Measurement of Scalar Dissipation in Premixed Flames, Combustion Science and Technology, 113-114:393-411, 1996. [11] O’YOUNG, F. and BILGER, R. W., Scalar Gradient and Related Quantities in Turbulent Premixed Flames, Combustion and Flame, 109:682-700, 1997. [12] PIRES DA CRUZ A., DEAN A.M. and GRENDA J.M., A Numerical Study of the Laminar flame Speed of Stratified methane-air Flames, Twenty-eighth Symposium on Combustion, The Combustion institute, pp 1925-1932, 2000. [13] PITTS W. M. and KASHIWAGI T., The Application of Laser-Induced Rayleigh Light Scattering to the Study of Turbulent Mixing, J. Fluids Mech., 141:391-429, 1984. [14] POINSOT T., VEYNANTE D., TROUVE A., and RUETSCH G., Proceeding of the 1996 Summer Program, Center for Turbulent Research, NASA Ames / Standford University, pp 111-141, 1996. [15] RA Y., Laminar Flame Propagation in a Stratified Charge, Ph. D thesis report, M.I.T., 1999. [16] RENOU B., DEGARDIN O., SAMSON E. and BOUKHALFA A., Local Flame Structure Analysis for Stratifed Charge Combustion, Proceedings of European Combustion Meeting, 2003. [17] RENOU B., SAMSON E. and BOUKHALFA A. « An Experimental Study Of Freely-Propagating Turbulent Propane-Air Flames In Stratified Inhomogeneous Mixtures », To be published in Combustion Science and Technology, 2004. [18] SATO K. and HIDAKA Y., Shock-Tube and Modelling Study of Acetone Pyrolysis and Oxidation, Combustion and Flame, 122:291-311, 2000. [19] THURBER M. C. , KIRBY, B. J., GRISCH, F., VOTSMEIER, M. and HANSON, R. K., Measurements and Modelling of Acetone Laser-Induced Fluorescence with implications for Temperature-Imaging Diagnostics, Appl. Opt., 37:4963-4978, 1998. [20] THURBER M. C. and HANSON, R. K., Pressure and Composition Dependences of Acetone Laser-Induced Fluorescence with Excitation at 248, 266 and 308 nm, Appl. Phys. B [21] THURBER M. C., Acetone Laser-Induced Fluorescence For temperature and Multiparameter Imaging in Gaseous Flows, PhD thesis report, Thermosciences Division Department of Mechanical Engineering Stanford University, U.S.A. 1999. [22] ZHAO F., LAI M.-C. and HARRINGTON D.L., Prog. Ener. Combust. Sci., 25:437, 1999.
