Transient Temperature Measurement of Unburned Gas Using Optic Heterodyne Interferometry
advertisement
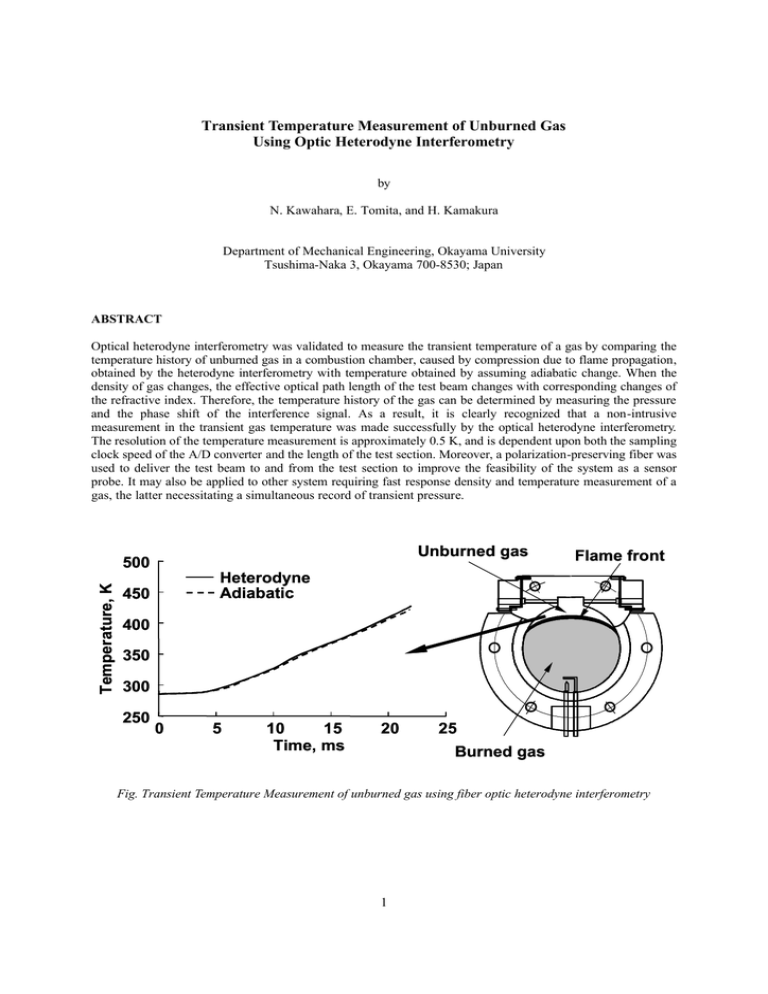
Transient Temperature Measurement of Unburned Gas Using Optic Heterodyne Interferometry by N. Kawahara, E. Tomita, and H. Kamakura Department of Mechanical Engineering, Okayama University Tsushima-Naka 3, Okayama 700-8530; Japan ABSTRACT Optical heterodyne interferometry was validated to measure the transient temperature of a gas by comparing the temperature history of unburned gas in a combustion chamber, caused by compression due to flame propagation, obtained by the heterodyne interferometry with temperature obtained by assuming adiabatic change. When the density of gas changes, the effective optical path length of the test beam changes with corresponding changes of the refractive index. Therefore, the temperature history of the gas can be determined by measuring the pressure and the phase shift of the interference signal. As a result, it is clearly recognized that a non-intrusive measurement in the transient gas temperature was made successfully by the optical heterodyne interferometry. The resolution of the temperature measurement is approximately 0.5 K, and is dependent upon both the sampling clock speed of the A/D converter and the length of the test section. Moreover, a polarization-preserving fiber was used to deliver the test beam to and from the test section to improve the feasibility of the system as a sensor probe. It may also be applied to other system requiring fast response density and temperature measurement of a gas, the latter necessitating a simultaneous record of transient pressure. Unburned gas Temperature, K 500 Flame front Heterodyne Adiabatic 450 400 350 300 250 0 5 10 15 Time, ms 20 25 Burned gas Fig. Transient Temperature Measurement of unburned gas using fiber optic heterodyne interferometry 1 1. INTRODUCTION When a homogeneous fuel-air mixture burns in a combustion chamber, the pressure and temperature of the unburned gas rise with flame propagation. The focus of much attention in recent engine research has been the spontaneous ignition of a portion of the unburned end-gas mixture in connection with engine knocking (Heywood, 1988, Pilling, 1997) and new diesel engines (Thring, 1989). It is very important to know the transient temperature of the unburned gas in these researches. However, it is not so easy to determine the transient temperature of gas in a combustion chamber. Several papers on gas-temperature measurement techniques using non-intrusive methods have been published since the 1950s. The end-gas temperature was measured by Chen et al. (1954) using an iodine absorption spectra, by Agnew (1960) using a two-wavelength infrared method, and by Burrows et al. (1961) using an infrared radiation pyrometer. Livengood et al. (1958), and Gluckstein and Walcutt (1961) used a sound-velocity method to measure the gas temperature in a cylinder. Progress in optical diagnostics has been remarkable in recent years. Raman scattering, Rayleigh scattering, and especially coherent anti-Stokes Raman spectroscopy (CARS) (Durao et al., 1992, Chiger, 1991), have been developed. Lucht et al. (1987) measured the temperature of the unburned n-butane-air mixture with CARS. Bood et al. (1997) developed rotational CARS and performed detailed kinetic calculations concerning auto-ignition. Nakada et al. (1990) discussed CARS measurement of the temperature of unburned gas in an engine combustion chamber in detail, and Akihama et al. (1992) improved the temperature resolution of CARS in an engine cylinder to ±30K. However, the application of these techniques is restricted because most of them are very expensive. On the other hand, laser interferometry (Goldstein, 1983, Fomin, 1998) offers both high potential resolution and non-intrusive temperature measurement. Garforth (1976) measured transient density in the unburned gas region in a spherical combustion chamber using modified Michelson interferometry, and obtained the transient gas temperature from the equation of state and pressure data. Achasov et al. (1993) applied the Michelson interferometry to studying the knocking process in the internal combustion engine. It is very difficult to apply these interferometry methods to combustion chambers and internal combustion engines because the measurements are usually very sensitive to mechanical vibration. However, during flame propagation, the authors (Hamamoto et al., 1994, Tomita et al., 1994, Tomita et al., 2000) measured the temperature change of a compressed unburned gas using Mach-Zehnder interferometry, using polarization preserving fibers and Köster prisms, to investigate the knock phenomenon. Therefore, in the present work, an optical heterodyne interferometry system was developed that is able to measure temperature history of the unburned gas with high temporal resolution, non-intrusively. Optical heterodyne interferometry is fairly insensitive to the fluctuations in signal intensity caused by mechanical vibration, and has therefore often been used to measure vibrations. In the present study, we applied optical heterodyne interferometry to a combustion chamber in order to measure the history of unburned gas temperatures. The accuracy of the measurements and the feasibility of this system for use in a combustion chamber are discussed. Moreover, optical fiber is used to allow the system to serve as a sensor probe. 2. EXPERIMENTAL METHOD AND PROCEDURE 2.1 Principles of Temperature Measurement The principles of optical interferometry for gas temperature measurement are shown in Fig. 1. Interferometric methods allow the measurement of variation in the refractive index along the line of sight. When the unburned gas is compressed by flame propagation, the density of the unburned gas in the combustion chamber changes, affecting the refractive index. Since the refractive index is influenced simultaneously by both temperature and changes in species concentration, gas composition data are needed to evaluate the gas temperature. The 2 Unburned gas mixture compressed with the flame propagation Interferometry Refractive index Gladstone-Dale Equation Gas composition Density Pressure Ideal gas law Temperature Fig. 1. Principle of temperature measurement using laser interferometry Reference side He-Ne laser HM M M HM :Mirror :Half mirror Test side M Detector HM AOM Fig. 2. A typical optical heterodyne interferometry difference between the optical paths of the test and reference beams varies, corresponding to changes in the refractive index in the end-gas region, which affect the interference light intensity. A typical optical heterodyne interferometry system is shown in Fig. 2. A beam from a He-Ne laser is divided into test and reference beams. The frequency of the test beam is shifted with an acoustic-optic modulator. Only the test beam passes through the test section. The two beams are made to interfere with each other by using a half mirror, and the resulting interference signal is detected. The difference between the test beam frequency and the reference beam makes the beat frequency. When a reference and a test beam have intensity, I0, the interference intensity, I, is expressed as [ ] I = 2 ⋅ I 0 1 + cos(2 π f b t + ∆ψ t ) (1) where fb and ∆ψτ denote the beat frequency and the change of phase shift in the test section, respectively. The 3 change of phase shift of the heterodyne signal over a given time t, ∆ψΗ, is related to ∆ψt as ∆ψ H = ∫ 2 πf t 0 b dt + ∆ψ t (2) The change of phase in the test section, ∆ψt, is expressed by ∆ψ t = 2 π∆Φ t / λ s = 2 π∆nt Lt / λ s (3) where Φt is the change in the optical path length, Lt is the length of the test section, λs is the wavelength of the test beam, and ∆nt is the change in the refractive index in the test section. A change in the refractive index of the gas causes the beat frequency to change, due to differences in the optical paths. Therefore, the beat frequency is a function of time, f b → f b (t ) (4) and changes in the beat frequency can be measured. The change of phase shift in the test section can be rewritten as ∆ψ t = ∆ψ H − ∫ t 0 2 π f b ( t )dt (5) The relationship between the refractive index and density can be approximated using the Gladstone-Dale equation, nt = 1 + ρ t RGt PR = 1 + t Gt Mt R0 Tt (6) where RGt is the Gladstone-Dale constant [cm3/mol] (Gardiner et al., 1980), which is determined by the wavelength of the laser and gas species, and Mt, R0, Pt and Tt denote the mean molecular weight, the mean gas constant, the pressure, and the temperature in the test section, respectively. The value of the Gladstone-Dale constant for each gas is presented for each laser wavelength in detail in ref. (Gardiner et al., 1980). When the gas mixture is composed of many species, the Gladstone-Dale constant of the mixture is expressed as follows, RGt = ∑R Gti xi (7) where x is the mole fraction of each gas and the subscript i indicates the i-th species of the mixture. The temperature of the unburned mixture can be obtained from (3), (5) and (6). Tt = 2 π Pt R G t T0 L t 2 π P0 R G t T0 Lt + ∆ψ t T0 R 0 λ (8) When the pressure and temperature of the initial state, P0 and T0, respectively, are known, the temperature of the gas can be obtained by measuring the pressure and the change of the beat frequency of the interfering light. 2.2 Experimental Apparatus The configuration of the constant volume pancake-shaped combustion chamber is shown in Fig. 3. The chamber has a height of 11.2 mm and a diameter of φ 78.0 mm. Premixed gas, such as a propane and air mixture or a methane and air mixture, is introduced at a certain pressure through a valve. The initial temperature of the fuel-air mixture is measured with a thermocouple. The homogeneous fuel-air mixture is ignited using spark electrodes at the side of the combustion chamber. After ignition, the flame propagates toward the side of the chamber away from the spark electrodes. The pressure history of the chamber is obtained using a pressure transducer. The laser beam used for optical heterodyne interferometry passes through a glass rod in the combustion chamber to prevent fuel-air mixture from leaking out. 4 Glass rod Test section Thermocouple Laser beam Pressure transducer Lt φ78 Valve 11.2 Spark electrodes Fig. 3. Combustion chamber M He-Ne laser λ /4 M λ /4 HM AOM M HM PF PBS :Mirror :Half mirror :Polarizing filter :Polarizing beam splitter λ /4 :1/4 wave retarder PT :Photo-transister PBS PBS PF PF PT PT Reference signal Fig. 4. M Test signal Experimental set-up Figure 4 shows the configuration of the optical arrangement of the combustion chamber. A stable He-Ne laser, with a wavelength λ of 632.8 nm and output power of 1 mW, provides a linear polarized beam for the measurements. The acoustic-optic modulator produces two beams. In this experiment, one beam is shifted in frequency by 80.0 MHz, and the other by 79.975 MHz. These beams meet at the polarized beam splitter and create a beat frequency of 25.0 kHz. Other beat frequencies (12.5 ~ 100 kHz) can be obtained by changing the difference in the initial frequency. After the polarized beam splitter, the beam is split into two by the half mirror. One beam is detected by a photo-transistor as a reference signal, the other is used for modified Michelson interferometry. The reference signal beam passes outside the combustion chamber and is reflected by a mirror, while the other passes through the test section, is reflected by a mirror, and passes back through the test section. 5 The initial temperature of the unburned mixture in the test region, at the side opposite the spark electrodes, is measured. The axis of the laser beam at the test region is 4.3 mm from the upper wall and 2.7 mm from the side wall. The length of the gas layer at the test region, Lt, is 18.74 mm. The two beams meet at the polarized beam splitter and interfere with each other. The interfering light is guided to a phototransistor, and changes in the intensity of the interfering light are detected. The reference signal, test signal and pressure data are collected using a A/D converter (maximum sampling rate: 500kHz). These data are analyzed using our original software. Table 1 shows the experimental conditions. Propane or methane is used as fuel. The equivalence ratio of each fuel-air mixture is unity. The initial pressure and temperature of the mixture inside the vessel are measured using a mercury manometer and J-type thermocouple, respectively. The Gladstone-Dale constant of the fuel-air mixture is calculated using equation (7) and data from ref. (Gardiner et al., 1980). Table 1. Experimental conditions φ Mixture C3H8-air 1.0 CH4-air P0 (kPa) 50 100 150 50 100 150 T0 (K) 286 286 287 287 287 288 RGt (cm3/mol) 7.2578 6.8667 3. EXAMPLES OF TEMPERATURE MEASUREMENT As shown in Fig. 3, a fuel-air mixture (equivalence ratio φ : 1.0) was introduced into the chamber at a circumstance temperature of a given pressure, and was then ignited by an electric spark. Figure 5 shows an example of the beat frequency of the test and reference signals, along with the pressure history. The fuel used Test signal Reference signal 29 28 27 800 26 600 25 400 24 200 0 Fig. 5. 5 10 15 Time, ms 20 25 Measured beat frequency with pressure history 6 0 Pressure, kPa Beat frequency, kHz 30 was propane. The initial pressure, P0, and temperature, T0, were 100 kPa and 286 K, respectively. The initial beat frequency, obtained using the acoustic-optic modulator, was 25.0 kHz. In these tests, time denotes the elapsed time from the spark. When a homogeneous fuel-air mixture burns and a flame propagates in a combustion chamber, the pressure of the unburned gas rises. During flame propagation, the beat frequency of the reference signal, which does not pass through the combustion chamber, is steady at 25.0 kHz. This figure clearly shows the stability of the reference signal and the acoustic-optic modulator. On the other hand, the beat frequency of the test signal increases from 25.0 kHz to 28.5 kHz due to the compression of unburned gas. Using the difference between the reference and test signals, the phase shift is obtained from Eq. (5). Examples of the phase shift and the pressure history, obtained simultaneously, are shown in Fig. 6; Fig. 6 (a) and (b) indicate data obtained for initial pressures of P0=100 kPa and 150 kPa, respectively. During the slight pressure increase at the first stage of combustion, the phase shift also increased slightly. As the pressure increase, the phase shift became greater at the final stage of combustion, the phase shift became larger. In the case of the higher initial pressure, the change of the phase shift was larger. When the flame first reached the test beam, the beam was refracted so much that the interference signal was temporarily weakened. The flame arrival time could be determined by utilizing this phenomenon. 200 600 100 400 0 200 0 5 10 15 Time, ms 20 Pressure, kPa ∆ψ t, rad 300 0 25 a) 300 1000 200 800 100 600 0 400 200 0 5 10 15 Time, ms 20 Pressure, kPa ∆ψ t, rad 400 0 25 b) Fig. 6. Measured phase shift and pressure in a constant volume combustion chamber a) Initial pressure P0=100 kPa b) Initial pressure P0=150 kPa 7 By measuring the change of the phase shift in the unburned gas region and the pressure history of the combustion chamber, the temperature history was obtained using Eq. (8). Figure 7 indicates the temperature obtained from the data shown in Fig. 6; Fig. 7 (a) and (b) indicate data obtained for initial pressures of P0=100 kPa and 150 kPa, respectively. The solid lines in Fig. 7 show the temperature of the unburned fuel-air mixture obtained using the developed heterodyne interferometry system. The dashed lines in Fig. 7 indicate the temperature history after the spark, calculated by using the measured pressure history and by assuming that the process of the unburned gas change after the spark is adiabatic, using Eq (9). Tt = T0 ( Pt P0 ) ( κ −1) κ (9) where κ is the ratio of the specific heats of the unburned fuel-air mixture. The mean value of the ratio of the specific heats of the unburned mixture, within a temperature range of 300-600 K and pressure range of 100-1200 kPa, was 1.361. The temperature increased with time and increasing pressure. Assuming adiabatic change, the temperature was approximately equal to that measured using heterodyne interferometry. When the initial temperature was the same, the temperature of the unburned gas was independent of the initial pressure, and rose to approximately 450 K. Similar results were obtained when a methane and air mixture was used as fuel. It is Temperature, K 500 Heterodyne Adiabatic 450 400 350 300 250 0 5 10 15 Time, ms 20 25 20 25 a) Temperature, K 500 Heterodyne Adiabatic 450 400 350 300 250 0 5 10 15 Time, ms b) Fig. 7. Temperature change of unburned mixture in a constant volume combustion chamber a) Initial pressure P0=100 kPa b) Initial pressure P0=150 kPa 8 clear that the developed heterodyne interferometry system can measure the transient temperature of unburned gas compressed by flame propagation in a constant volume vessel. Hence, the resolution for the temperature measurement of our system is discussed. In the present system, an initial beat frequency of 25 kHz and sampling frequency of 500 kHz were used. Before the spark, 20 sampling points were obtained during one period of the beat frequency. However, during the flame propagation, only 18 sampling points were obtained due to the increase of the test signal beat frequency. If 1/18 of the beat signal period is considered to be the resolution of the temperature measurements, then the measurement resolution, which changes with density, is about 0.5 K. Figure 8 indicates the change of measurement resolution, ∆T, with pressure, Pt, for temperature measurements of unburned gas compressed by flame development. The value of ∆T changes with density; it was approximately 0.45 ~ 0.8 K for the present tests. These values indicate a higher resolution than that obtained using our previous Mach-Zehnder optical system with polarization-preserving fibers and Köster prisms (Tomita et al., 1994). The resolution of temperature and time can be increased by using a A/D converter with a higher sampling rate, and by increasing the length of the test section. It is recognized that the heterodyne interferometry can be applied to the transient gas temperature measurement in a closed combustion chamber. Sampling frequency: 500 kHz Initial beat frequency : 25 kHz Δ T, K Δ T, K 0.8 Tt , K 500 450 0.7 400 0.6 350 0.5 300 0.4 100 Fig. 8. 200 300 400 P t, kPa Tt , K 0.9 250 500 Resolution for temperature measurement of unburned gas 4. FIBER OPTICAL HETERODYNE INTERFEROMETRY In the previous section, the feasibility of optical heterodyne interferometry as a technique for measuring the transient gas temperature was shown. A possible problem with heterodyne interferometry is the delivery of the test beam, since any change in the position of the optical system in relation to the combustion chamber affects the results due to the sensitive interferometric signal. A polarization-preserving fiber is therefore used to deliver the test beam to and from the combustion chamber. Figure 9 shows the fiber optical heterodyne interferometry system using a polarization-preserving fiber. Delivery of the test beam to and from the test section is accomplished using a 1.5 m polarization-preserving fiber. The polarization of the signal is important for heterodyne interferometry. A stable He-Ne laser has a long coherence length (over 10 km). The difference between the path lengths of the test and reference beams is insignificant. The 1/4 wave retarder used for the test beam without the fiber system is replaced by a 1/2 wave retarder so that the polarization angle of the fiber coincides with the test beam. A distributed index lens is fixed at each end of the fiber to generate a collimation beam and to introduce the beam into the fiber. This distributed index lens has 9 an anti-reflection coating to decrease the cross-talk effect. The test beam passes through the fiber and meets the reference beam at the polarized beam splitter, where the two beams interfere with each other. The interfering light is guided to a phototransistor, and changes in the intensity are detected. As an example, a temperature history obtained by the developed fiber optical heterodyne interferomtry system is shown in Fig. 10. The fuel mixture was propane and air (equivalence ratio φ : 1.0, P0=100 kPa, T0=286 K). Similar results to those without a fiber optical system were obtained. Thus, the feasibility of a temperature sensor probe using a polarized fiber was confirmed. Optical fiber for preserving polarization M He-Ne laser λ /4 M HM M HM PF PBS :Mirror AOM PBS :Half mirror :Polarizing filter PF :Polarizing beam splitter PT SML :Micro-lens λ/4 : 1/4 wave retarder λ/2 : 1/2 wave retarder Reference RG :Rod glass signal PT :Photo-transister Fig. 9. λ /2 PBS M SML PF PT Test signal Developed fiber optic heterodyne interferometry 500 Temperature, K RG Heterodyne Adiabatic 450 400 350 300 250 0 5 10 15 Time, ms 20 25 Fig. 10. Temperature change of unburned mixture in a constant volume combustion chamber using fiber optic heterodyne interferometry 10 5. CONCLUSIONS Non-intrusive measurements of transient gas temperatures were made successfully using an optical heterodyne interferometry system. This system successfully measured the temperature of unburned gas compressed by the flame propagation in a constant volume combustion chamber. For a propane-air or methane-air mixture, with φ=1.0, P0=50 ~ 150 kPa, and T0=286 K, the temperature measurement resolution was 0.45 ~ 0.8 K. This system was validated to measure the transient temperature of a gas by comparing with temperature obtained by assuming adiabatic change. Moreover, a polarization-preserving fiber was used to deliver the test beam to and from the test section to improve the feasibility of the system as a sensor probe. It may also be applied to other system requiring fast response density and temperature measurement of a gas, the latter necessitating a simultaneous record of transient pressure. REFERENCES Achasov, O., Fomin, N., Penyazkov, O., Oznobishin, A., and Fisson, F. (1993). “Interferometric study of combustion in a spark eginition engine”, Proc. of the Int. Symp. on Internal Comb. Engines, KONES'93, 553-562. Agnew, W.G. (1960). “End Gas Temperature Measurement by Two-Wavelength Infrared Radiation Method”, SAE Trans, 68, 495-513. Akihama, K., Asai, T., Kubo, S., Nakano, M., Yamazaki, S., and Iguchi, S. (1992). “Unburned Gas Temperature Measurements by CARS in a Spark-Ignition Engine”, (in Japanese), The 10th Internal Comb. Engine Symp. in Japan, 283-288. Bood, J., Bengtsson, P-E., Mauss, F., Burgdorf, K., and Denbratt, I. (1997). “Knock in Spark-ignition Engines: End-gas Temperature Measurements using Rotational CARS and Detailed Kinetic calculations of the autoignition process”, SAE paper 971669. Burrows, M.C., Shimizu, S., Myers, P.S., and Uyehara, O.A. (1961) “The Measurement of Unburned Gas Temperature in an Engine by an Infrared pyrometer”, SAE Trans., 66, 514-528. Chen, S.K., Beck, N.J., Uyehara, O.A., and Myers, P. (1954). “Compression and End-Gas Temperature from Iodine Absorption Spectra”, SAE Trans., 62, 503-513. Chiger, N. (1991). “Combustion Measurements”, Hemisphere Publishing Corp. Durao, D.F.G., et al. (1992). “Combusting Flow Diagnostics”, Kluwer Academic Publishers. Fomin, N.A. (1998). “Speckle Photography for Fluid Mechanics Measurements”, Springer-Verlag. Gardiner, W.C.Jr, Hidaka, Y., and Tanzawa, T. (1980). “Refractivity of Combustion Gases”, Combust. and Flame, 40, 213-219. Garforth, A.M. (1976). “Unburnt Gas Density Measurements in a Spherical Combustion Bomb by Infinite-fringe Laser Interferometry”, Combust. and Flame, 26, 343-352. Gluckstein, M.E., and Walcutt, C. (1961). “End-gas Temperature-pressure histories and their relation to knock”, SAE Trans., 69, 529-531. Goldstein, R.J. (1983). “Fluid Mechanics Measurements”, Hemisphere Publishing Corp. Hamamoto, Y., Tomita, E., and Jiang, D. (1994). “Temperature Measurement of End Gas under Knocking Condition in a Spark-Ignition Engine by Laser Interferometry”, JSAE Review, 15-2, 117-122. 11 Heywood, J.B. (1988). “Internal Combustion Engine Fundamentals”, McGraw-Hill, Inc. Livengood, J.C., Taylor, C.F., and Wu, P.C. (1958). “Measurement of Gas Temperature in an Engine by Velocity of Sound Method”, SAE Trans, 66, 683-699. Lucht, R.P., Teets, R.E., Green, R.M., Palmer, R.E., and Ferguson, C.R. (1987). “Unburned Gas Temperature in an Internal Combustion Engine. I: CARS Temperature Measurements”, Combust. Sci. and Technol., 55, 41. Nakada, T, Ito, T., and Takagi, Y. (1990). “Unburnt Gas Temperature Measurements Using Single Shot CARS in a Spark Ignition Engine”, Proc. of Int. Symp. on COMODIA 90, 393-399. Pilling, M.J. (1997). “Low-Temperature Combustion and Autoignition”, Elsevier Science. Thring, R.H. (1989). “Homogeneous Charge Compression Ignition (HCCI) Engines”, SAE Paper 892068. Tomita, E., Hamamoto, Y., and Jiang, D. (1994). “Temperature and Pressure Histories of End Gas under Knocking Condition in a S.I. Engine”, Proc. of Int. Symp. on COMODIA 94, 183-188. Tomita, E., Hamamoto, Y., and Jiang, D. (2000). “Measurement of Temperature History of Unburned Gas Before Knocking in a Spark-Ignition Engine Using Laser Interferometry”, Meas. Sci. Technol., 11, 1-7. 12
