Which is more likely? Binomial and Normal distributions
advertisement
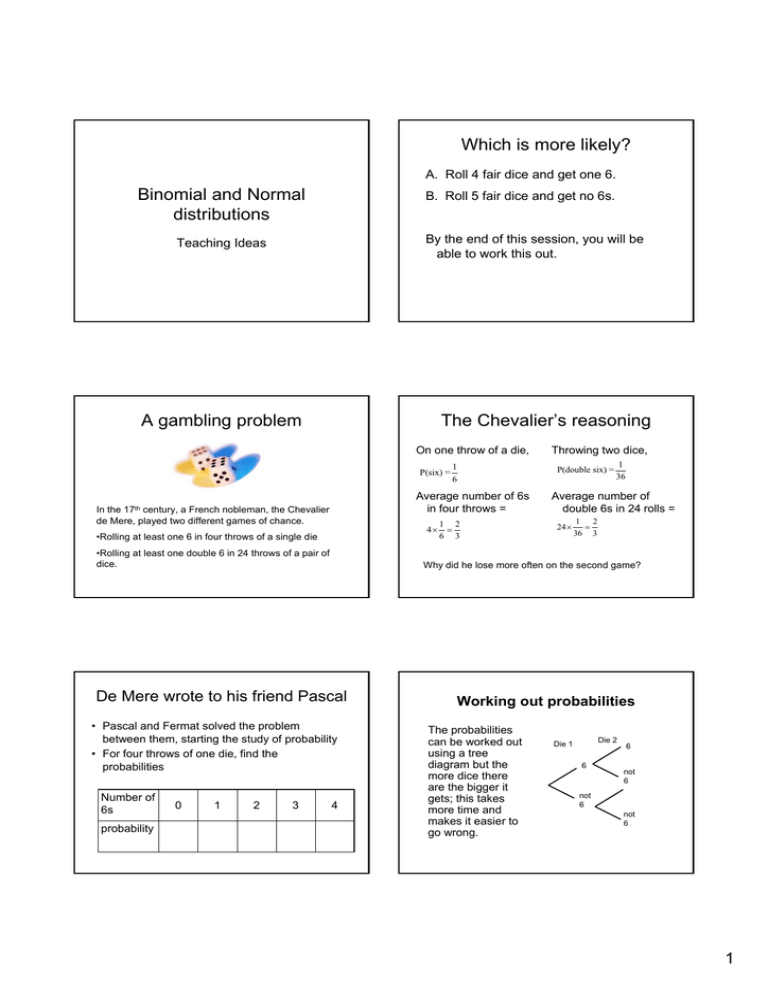
Which is more likely? A. Roll 4 fair dice and get one 6. Binomial and Normal distributions B. Roll 5 fair dice and get no 6s. By the end of this session, you will be able to work this out. Teaching Ideas A gambling problem The Chevalier’s reasoning On one throw of a die, 1 P(six) = 6 Average number of 6s in four throws = In the 17th century, a French nobleman, the Chevalier de Mere, played two different games of chance. 4× •Rolling at least one 6 in four throws of a single die •Rolling at least one double 6 in 24 throws of a pair of dice. • Pascal and Fermat solved the problem between them, starting the study of probability • For four throws of one die, find the probabilities probability 0 1 2 3 P(double six) = 1 36 Average number of double 6s in 24 rolls = 24 × 1 2 = 36 3 Why did he lose more often on the second game? De Mere wrote to his friend Pascal Number of 6s 1 2 = 6 3 Throwing two dice, 4 Working out probabilities The probabilities can be worked out using a tree diagram but the more dice there are the bigger it gets; this takes more time and makes it easier to go wrong. Die 2 Die 1 6 6 not 6 not 6 not 6 1 Finding a pattern Number of No 6s One 6 dice ⎛5⎞ ⎛1⎞ 1 × ⎜ ⎟ 1× ⎜ ⎟ ⎝6⎠ ⎝6⎠ 1 2 3 4 5 ⎛5⎞ ⎜ ⎟ ⎝6⎠ 2 ⎛5⎞ ⎜ ⎟ ⎝6⎠ ⎛5⎞ ⎜ ⎟ ⎝6⎠ 3 4 Two 6s ⎛1⎞ ⎜ ⎟ ⎝6⎠ ⎛1⎞ ⎛5⎞ 2×⎜ ⎟×⎜ ⎟ ⎝6⎠ ⎝6⎠ Three 6s Four 6s 2 2 2 ⎛1⎞ ⎛5⎞ 1 5 3 × ⎜ ⎟ × ⎜ ⎟ 3 × ⎛⎜ ⎞⎟ × ⎛⎜ ⎞⎟ ⎝6⎠ ⎝6⎠ ⎝6⎠ ⎝6⎠ 3 In general ⎛1⎞ ⎜ ⎟ ⎝6⎠ 3 3 ⎛1⎞ ⎛5⎞ ⎛1⎞ ⎛5⎞ ⎛1⎞ ⎛5⎞ 4×⎜ ⎟×⎜ ⎟ 6×⎜ ⎟ ×⎜ ⎟ 4×⎜ ⎟ ×⎜ ⎟ ⎝6⎠ ⎝6⎠ ⎝6⎠ ⎝6⎠ ⎝6⎠ ⎝6⎠ 2 2 ⎛1⎞ ⎜ ⎟ ⎝6⎠ 4 What is success? P (X = r) = nCr pr qn-r r = 0, 1, 2, ……….. n where p is the probability of success and q is the probability of failure X ~ B (n, p) shows that the random variable, X, has a binomial distribution with n trials and probability p of success each time. Back to the first question P (X = r) = nCr pr qn-r In this case, 6 on a die. What is failure? A. Roll 4 fair dice and get one 6. n= p= r= In this case “not 6” on a die. p = P (success) = 1/6 in this case q = P (failure) = 5/6 in this case r = 0, 1, 2, 3 n=3 for 3 dice B. Roll 5 fair dice and get no 6s. n= p= r= Where does the Binomial distribution occur? • You are conducting an experiment or trial n times – Eg tossing a fair coin 8 times • There are 2 outcomes, which we can think of as “success” or “failure” – Eg heads and tails • The probability of “success” is the same each time (symbol p). The probability of “failure” is 1-p – The probability of “success” on any trial is independent of what has happened in previous trials. • The random variable we are interested in is “the number of successes” 2 Situation: Toss a biased coin 10 times Situation: Throw a fair die 7 times Random variable: The number of heads Random variable: The number of 4s Situation: Throw a fair die 12 times Situation: Throw a fair die Random variable: The score Random variable: The number of even scores Situation: Throw a fair die repeatedly Situation: Choose 6 students from a class of 30 Random variable: The number of times you have to throw it to get a 6 Random variable: The number of girls chosen Situation: Choose 6 students from a large school Random variable: The number of boys chosen Situation: Choose a jury Random variable: The number of black people on the jury Situation: Open a tube of “smarties” and count the number of each colour Random variable: The number of orange smarties Situation: Take a 40 question multiple choice test by guessing each answer Random variable: The number of questions wrong Situation: Each student in the class tosses a coin Random variable: The number of heads Situation: The probability of my suitcase getting to the right destination is 0.95. Random variable: The number of passengers on a flight with “lost” luggage These 4 samples are taken from the Census at School database. What population is the sample from? Do you think the sample is from a Normal population? Why? http://datatool.censu satschool.org.uk/dat atool.swf

