Delay Fault Model Evaluation Using Readily‐Available Tester Response Data
advertisement

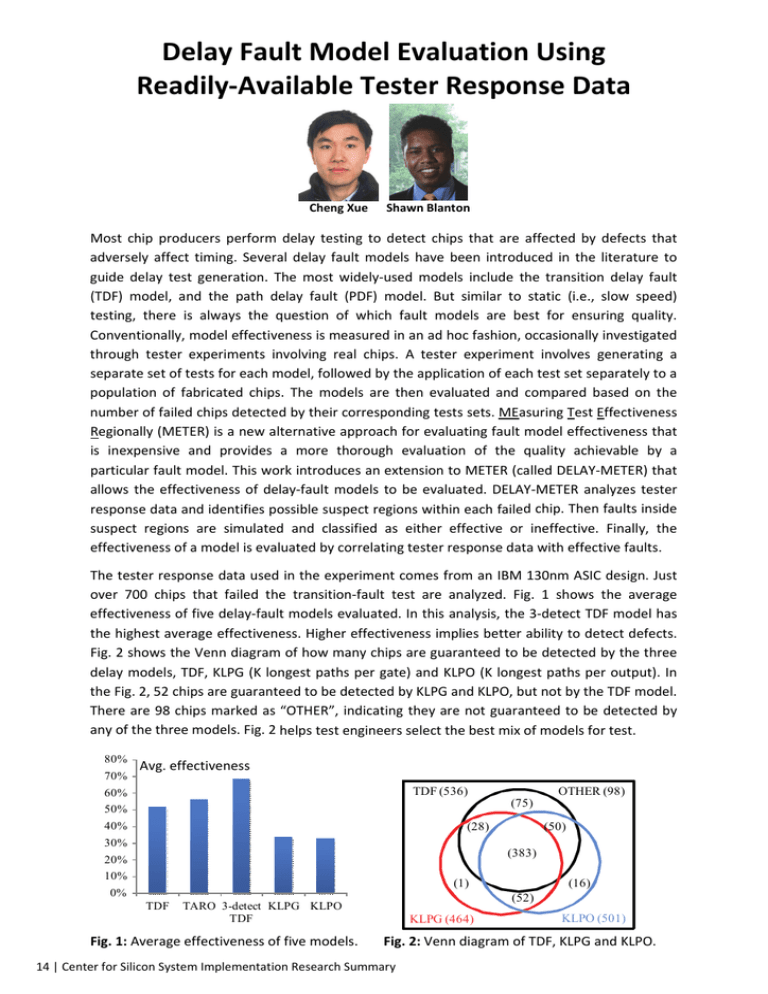
Delay Fault Model Evaluation Using Readily‐Available Tester Response Data Cheng Xue Shawn Blanton Most chip producers perform delay testing to detect chips that are affected by defects that adversely affect timing. Several delay fault models have been introduced in the literature to guide delay test generation. The most widely‐used models include the transition delay fault (TDF) model, and the path delay fault (PDF) model. But similar to static (i.e., slow speed) testing, there is always the question of which fault models are best for ensuring quality. Conventionally, model effectiveness is measured in an ad hoc fashion, occasionally investigated through tester experiments involving real chips. A tester experiment involves generating a separate set of tests for each model, followed by the application of each test set separately to a population of fabricated chips. The models are then evaluated and compared based on the number of failed chips detected by their corresponding tests sets. MEasuring Test Effectiveness Regionally (METER) is a new alternative approach for evaluating fault model effectiveness that is inexpensive and provides a more thorough evaluation of the quality achievable by a particular fault model. This work introduces an extension to METER (called DELAY‐METER) that allows the effectiveness of delay‐fault models to be evaluated. DELAY‐METER analyzes tester response data and identifies possible suspect regions within each failed chip. Then faults inside suspect regions are simulated and classified as either effective or ineffective. Finally, the effectiveness of a model is evaluated by correlating tester response data with effective faults. The tester response data used in the experiment comes from an IBM 130nm ASIC design. Just over 700 chips that failed the transition‐fault test are analyzed. Fig. 1 shows the average effectiveness of five delay‐fault models evaluated. In this analysis, the 3‐detect TDF model has the highest average effectiveness. Higher effectiveness implies better ability to detect defects. Fig. 2 shows the Venn diagram of how many chips are guaranteed to be detected by the three delay models, TDF, KLPG (K longest paths per gate) and KLPO (K longest paths per output). In the Fig. 2, 52 chips are guaranteed to be detected by KLPG and KLPO, but not by the TDF model. There are 98 chips marked as “OTHER”, indicating they are not guaranteed to be detected by any of the three models. Fig. 2 helps test engineers select the best mix of models for test. 80% 70% Avg. effectiveness TDF (536) 60% 50% (28) 40% 30% OTHER (98) (50) (383) 20% 10% (1) 0% TDF (75) TARO 3-detect KLPG KLPO TDF (16) (52) KLPG (464) KLPO (501) Fig. 1: Average effectiveness of five models. Fig. 2: Venn diagram of TDF, KLPG and KLPO. for Silicon System Implementation Research Summary 14 | Center


