Document 10409631
advertisement
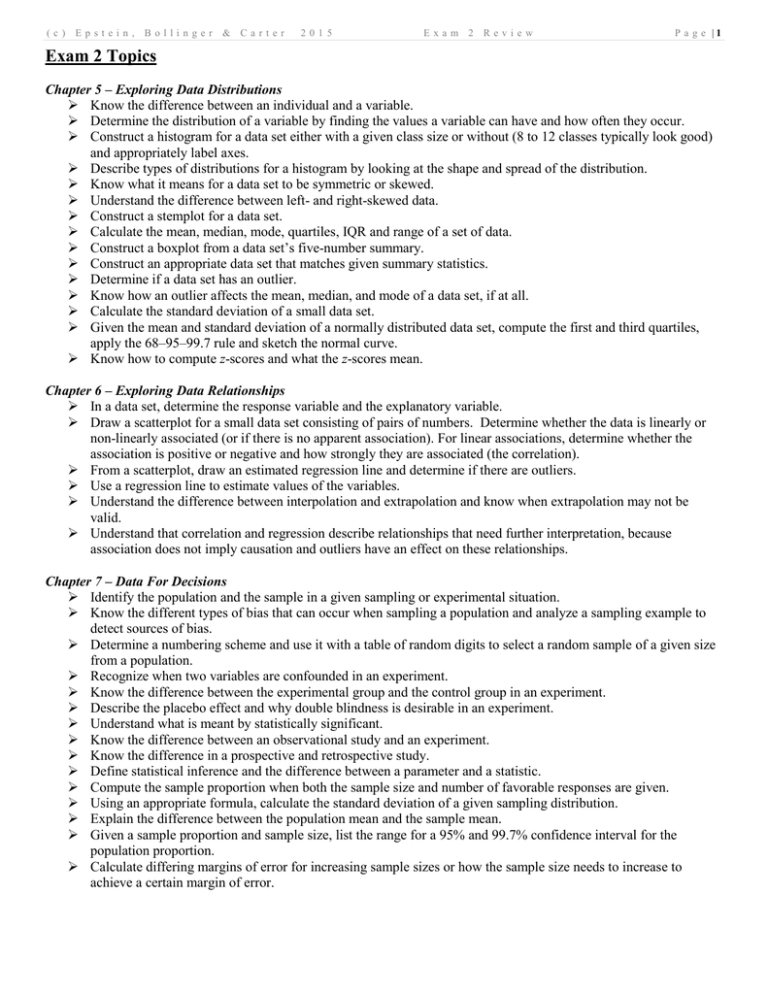
(c) Epstein, Bollinger & Carter 2015 Exam 2 Review P a g e |1 Exam 2 Topics Chapter 5 – Exploring Data Distributions Know the difference between an individual and a variable. Determine the distribution of a variable by finding the values a variable can have and how often they occur. Construct a histogram for a data set either with a given class size or without (8 to 12 classes typically look good) and appropriately label axes. Describe types of distributions for a histogram by looking at the shape and spread of the distribution. Know what it means for a data set to be symmetric or skewed. Understand the difference between left- and right-skewed data. Construct a stemplot for a data set. Calculate the mean, median, mode, quartiles, IQR and range of a set of data. Construct a boxplot from a data set’s five-number summary. Construct an appropriate data set that matches given summary statistics. Determine if a data set has an outlier. Know how an outlier affects the mean, median, and mode of a data set, if at all. Calculate the standard deviation of a small data set. Given the mean and standard deviation of a normally distributed data set, compute the first and third quartiles, apply the 68–95–99.7 rule and sketch the normal curve. Know how to compute z-scores and what the z-scores mean. Chapter 6 – Exploring Data Relationships In a data set, determine the response variable and the explanatory variable. Draw a scatterplot for a small data set consisting of pairs of numbers. Determine whether the data is linearly or non-linearly associated (or if there is no apparent association). For linear associations, determine whether the association is positive or negative and how strongly they are associated (the correlation). From a scatterplot, draw an estimated regression line and determine if there are outliers. Use a regression line to estimate values of the variables. Understand the difference between interpolation and extrapolation and know when extrapolation may not be valid. Understand that correlation and regression describe relationships that need further interpretation, because association does not imply causation and outliers have an effect on these relationships. Chapter 7 – Data For Decisions Identify the population and the sample in a given sampling or experimental situation. Know the different types of bias that can occur when sampling a population and analyze a sampling example to detect sources of bias. Determine a numbering scheme and use it with a table of random digits to select a random sample of a given size from a population. Recognize when two variables are confounded in an experiment. Know the difference between the experimental group and the control group in an experiment. Describe the placebo effect and why double blindness is desirable in an experiment. Understand what is meant by statistically significant. Know the difference between an observational study and an experiment. Know the difference in a prospective and retrospective study. Define statistical inference and the difference between a parameter and a statistic. Compute the sample proportion when both the sample size and number of favorable responses are given. Using an appropriate formula, calculate the standard deviation of a given sampling distribution. Explain the difference between the population mean and the sample mean. Given a sample proportion and sample size, list the range for a 95% and 99.7% confidence interval for the population proportion. Calculate differing margins of error for increasing sample sizes or how the sample size needs to increase to achieve a certain margin of error.
