SPACE TELESCOPE SCIENCE INSTITUTE
advertisement
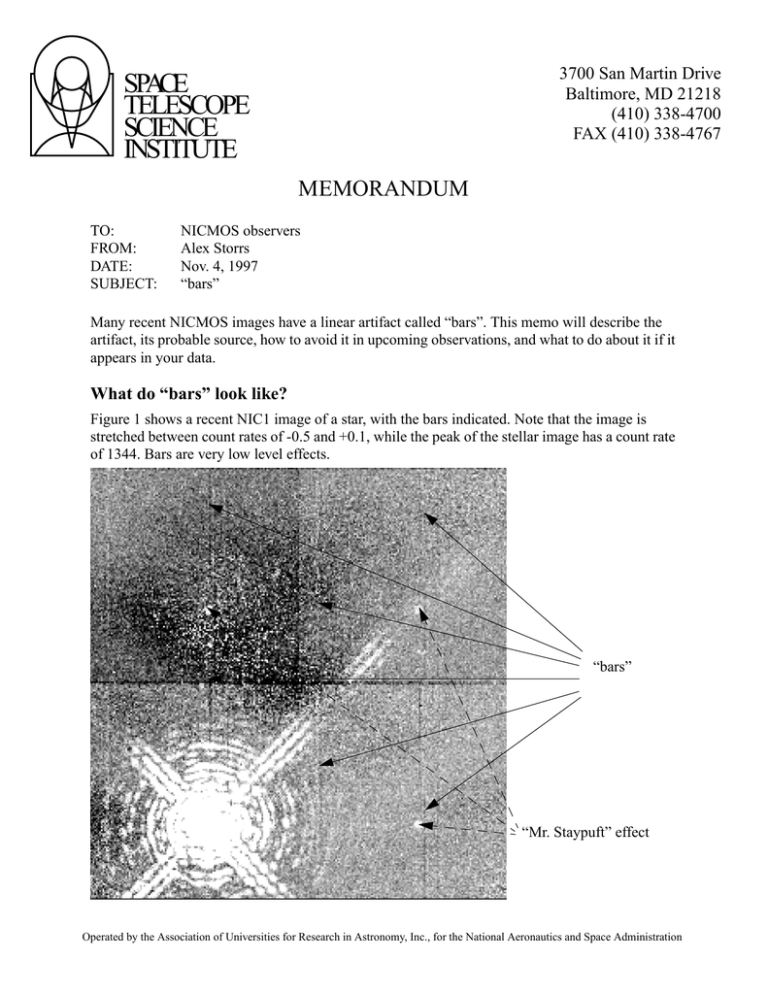
3700 San Martin Drive Baltimore, MD 21218 (410) 338-4700 FAX (410) 338-4767 SPACE TELESCOPE SCIENCE INSTITUTE MEMORANDUM TO: FROM: DATE: SUBJECT: NICMOS observers Alex Storrs Nov. 4, 1997 “bars” Many recent NICMOS images have a linear artifact called “bars”. This memo will describe the artifact, its probable source, how to avoid it in upcoming observations, and what to do about it if it appears in your data. What do “bars” look like? Figure 1 shows a recent NIC1 image of a star, with the bars indicated. Note that the image is stretched between count rates of -0.5 and +0.1, while the peak of the stellar image has a count rate of 1344. Bars are very low level effects. “bars” “Mr. Staypuft” effect Operated by the Association of Universities for Research in Astronomy, Inc., for the National Aeronautics and Space Administration 2 Note that the bars repeat in each quadrant, although in places where there is significant signal they are quickly swamped by the noise in that signal. Also note the ghost copies of the bright star (the “Mr. Staypuft” effect). These appear in the same position in each quadrant as the source in its quadrant. The above example is a NIC1 image. In NIC2 and NIC3, the “bars” appear a rows rather than columns. In all cases the amplitude is very low, the effect is more cosmetic than photometric. What can I do to avoid “bars”? Since “bars” seem to be caused between interference in the readout of the desired camera and an unused camera or cameras (which are in “autoflush” mode) the obvious fix is to operate all three cameras even when the parallel observations are of no scientific use. This is done by adding the other cameras in parallel to the desired one in the RPS2 file. The parallel exposures should be tailored with RPS2 so that they take as long as the primary one. If this causes serial buffer dumps (i.e. the instrument operation is halted to dump the data) you may want to change to parallels to use as few reads as possible. This can be done by choosing a multiaccum sequence that will cover the time of the primary exposure in as few NSAMPs as possible, or by using the parallel cameras in ACCUM mode. What can I do about “bars” in my data? If you can’t ignore the presence of “bars” in your calibrated data, you must mask them out during the calibration process. You must first determine where the “bars” are in each read of the image, then partially process the raw image to get an ima image, edit the data quality (dq) image(s) in the ima image, rename it to raw, and finish the processing. In detail: Determine where the bars are by subtracting successive reads: the msarith procedure is useful for this. “operand1” and “operand2” are your _raw.fits file, and “op” is subtraction (“-”). If you have N samples, then the “list1” should be 1 through N, and the “list2” should be 2 through N+1 (note that the N+1 read is the “zeroth” read). Display each difference image individually, stretched between -10 and 10. If bars appear in the first group but not in the second, the bars must be in the first group of the _raw.fits file. If the bars appear in two successive groups, they must be in the group in the _raw.fits file that is common to both difference images. Note the position of the bars. Note where they “break”-- that is, shift by three rows (or columns) perpendicular to the “bars”. Mask out the “bars” by setting the dq bits corresponding to the bad pixels to 256. You will need a full dq array, not the compressed array that exists in the _raw.fits file, so you’ll have to run calnica on the _raw.fits. Set the CRIDCALC header parameter to OMIT and give the output a unique name (like “test”) so you can work on this intermediate stage without cluttering our workspace up with unnecessary copies of your data. You can use the imreplace procedure to change the data bits. For example, if there are bars in columns 77,78, and 79 of the 2nd read, with a break at row 62, you would need a command like “imrep test_ima.fits[dq,2][77:79,1:62] 256” to mask out the first section of bar. Because the bar shifts over three columns, you’ll need more commands: use “imrep test_ima.fits[dq,2][74:76,63:128] 256” to mask out the second section. For the other parts 3 of the bar you’d need image sections of [77:79,129:190], [74:76,191:256], [205:207,1:62], [202:204,63:128], [205:207,129:190] and [202:204,191:256]. If you want to fix the bars more quickly you can just use sections of [74:79,1:256] and [202:207,1:256]. Note that each instance of “bars” (often in every other read of a sequence) must be masked this way. Now reprocess the image to get rid of the “bars”. Rename the test_ima.fits to test_raw.fits, edit the header parameters of test_raw.fits to OMIT everything but the CRIDCALC processing (set that to PERFORM), and run calnica with the output set to e.g. your original ipppssoot name. The output _cal.fits file will not have “bars”, but will have noisier streaks where the “bars” were. The following figure shows the same image as in the first figure, but treated as above.

