ELEN E4810 Digital Signal Processing Final Exam Tuesday 2011-12-20 09:00-11:30 (150 min)
advertisement

ELEN E4810 Digital Signal Processing
Final Exam
Dan Ellis <dpwe@ee.columbia.edu>
Tuesday 2011-12-20 09:00-11:30 (150 min)
This test consists of 4 questions, each with equal weight.
You have two and a half hours (150 minutes) to complete the test.
This test is open-book: you are permitted to refer to your notes and textbooks during the test.
You may use a calculator for numerical work, but not for graphing.
You must show all your workings to get credit for an answer.
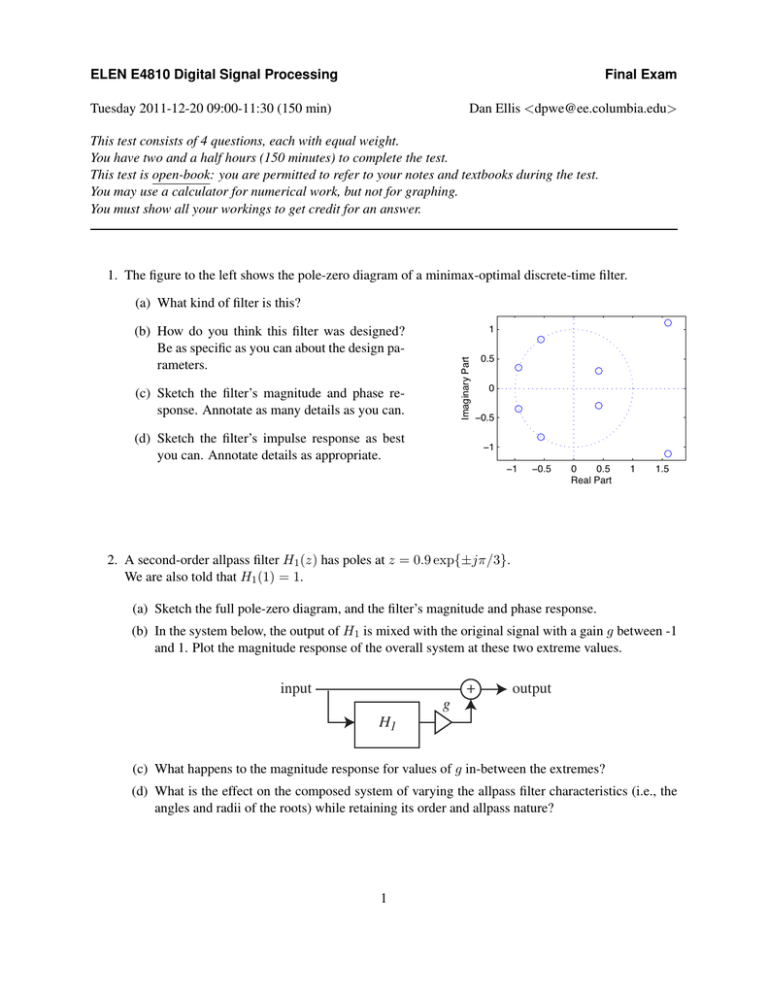
1. The figure to the left shows the pole-zero diagram of a minimax-optimal discrete-time filter.
(a) What kind of filter is this?
1
Imaginary Part
(b) How do you think this filter was designed?
Be as specific as you can about the design parameters.
(c) Sketch the filter’s magnitude and phase response. Annotate as many details as you can.
0.5
0
−0.5
(d) Sketch the filter’s impulse response as best
you can. Annotate details as appropriate.
−1
−1
−0.5
0
0.5
Real Part
1
1.5
2. A second-order allpass filter H1 (z) has poles at z = 0.9 exp{±jπ/3}.
We are also told that H1 (1) = 1.
(a) Sketch the full pole-zero diagram, and the filter’s magnitude and phase response.
(b) In the system below, the output of H1 is mixed with the original signal with a gain g between -1
and 1. Plot the magnitude response of the overall system at these two extreme values.
input
g
+
output
H1
(c) What happens to the magnitude response for values of g in-between the extremes?
(d) What is the effect on the composed system of varying the allpass filter characteristics (i.e., the
angles and radii of the roots) while retaining its order and allpass nature?
1
3. An IIR bandpass filter can be created from a lowpass prototype via a transformation that duplicates
the passband around the positive- and negative-frequency passbands; such a system has double the
order of the lowpass prototype. The figure below shows the s-plane pole-zero diagram of a bandpass
filter based on a 4th order Butterworth filter low-pass prototype. Its 3dB points are at Ω = 1 and
Ω = 1.5 rad/sec.
(a) We scale this filter and use the bilinear transform to create a DT bandpass filter with a
lower passband 3dB edge at ω = 0.25π
rad/samp. Where does the upper edge fall?
(c) How could you best implement this filter using second-order-section blocks? Without attempting to work out the actual coefficients,
indicate as much as you can about the structure of this implementation.
(d) Each of the delay elements in the answer to
part (c) is replaced by a two-sample delay
(z −2 ). Sketch the magnitude response of this
new system.
1
0.5
Imaginary Part
(b) Sketch this DT filter’s magnitude response,
labeling any points of interest such as local
minima and maxima.
1.5
4
0
−0.5
−1
−1.5
−1
−0.5
0
Real Part
0.5
1
4. In music synthesis, we often want to start with an “ideal”, harmonic-rich waveform which can then
be shaped by filtering. One useful waveform is a square wave, which in continuous time is given by:
(
1
r · τ0 ≤ t < (r + 12 ) · τ0
x(t) =
−1
otherwise
for all r = 0, ±1, ±2, . . . to give a square wave with period τ0 = 2π/Ω0 .
(a) Sketch the continuous-time Fourier transform magnitude spectrum of x(t).
(b) A discrete-time waveform can be obtained by “sampling” x(t), i.e.
(
1
r · τ0 ≤ nT < (r + 21 ) · τ0
x[n] =
−1
otherwise
where T = 1/fsamp is the sampling period. Sketch the magnitude spectrum of this sampled
signal. You can assume T ≈ τ0 /5.
(c) If the frequency of the underlying square wave is increased by a small factor to Ω1 = (1+)Ω0 ,
what happens to the spectrum of the discrete-time signal? Make a sketch to show how each
component changes.
(d) What are the limitations or drawbacks of this simple mechanism for generating a discrete-time
square wave? How might you create an oscillator that avoids these problems?
2


