W P O .
advertisement
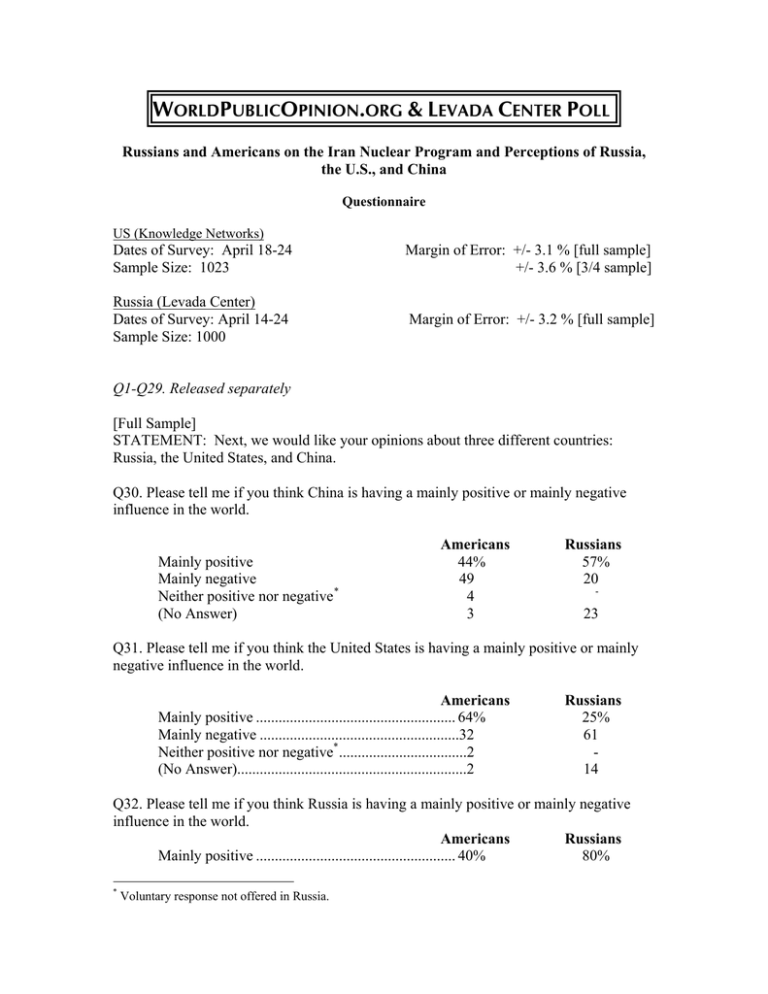
WORLDPUBLICOPINION.ORG & LEVADA CENTER POLL. Russians and Americans on the Iran Nuclear Program and Perceptions of Russia, the U.S., and China Questionnaire US (Knowledge Networks) Dates of Survey: April 18-24 Sample Size: 1023 Margin of Error: +/- 3.1 % [full sample] +/- 3.6 % [3/4 sample] Russia (Levada Center) Dates of Survey: April 14-24 Sample Size: 1000 Margin of Error: +/- 3.2 % [full sample] Q1-Q29. Released separately [Full Sample] STATEMENT: Next, we would like your opinions about three different countries: Russia, the United States, and China. Q30. Please tell me if you think China is having a mainly positive or mainly negative influence in the world. Mainly positive Mainly negative Neither positive nor negative * (No Answer) Americans 44% 49 4 3 Russians 57% 20 - 23 Q31. Please tell me if you think the United States is having a mainly positive or mainly negative influence in the world. Americans Mainly positive ..................................................... 64% Mainly negative .....................................................32 Neither positive nor negative* ..................................2 (No Answer).............................................................2 Russians 25% 61 14 Q32. Please tell me if you think Russia is having a mainly positive or mainly negative influence in the world. Americans Russians Mainly positive ..................................................... 40% 80% * Voluntary response not offered in Russia. Rus. & Amer. On Iran, Perceptions April 14-24, 2006 Mainly negative .....................................................53 Neither positive nor negative* ..................................5 (No Answer).............................................................2 6 14 STATEMENT: Please tell me if your opinion of each of the following is: Q33: a. America’s system of government Americans Russians b. Russia’s system of government Americans Russians c. China’s system of government Americans Russians very favorable somewhat favorable somewhat unfavorable very unfavorable 43% 9 40% 45 10% 21 4% 6 1 5 25 42 48 36 20 7 1 14 13 42 40 11 40 3 STATEMENT: Please tell me if your opinion of each of the following is: Q34: a. America’s economic system Americans Russians b. Russia’s economic system Americans Russians c. China’s economic system Americans Russians very favorable somewhat favorable somewhat unfavorable very unfavorable 27% 23 48% 50 16% 11 5% 2 1 3 20 28 52 47 20 13 6 18 31 49 35 9 21 3 WORLDPUBLICOPINION.ORG & LEVADA CENTER 2 Rus. & Amer. On Iran, Perceptions April 14-24, 2006 STATEMENT: Please tell me if your opinion of each of the following is: Q35: very favorable a. How America uses military power and the threat of force Americans Russians b. How Russia uses military power and the threat of force Americans Russians c. How China uses military power and the threat of force Americans Russians somewhat favorable somewhat unfavorable very unfavorable 19% 5 35% 8 28% 36 14% 38 2 10 22 55 46 12 22 5 3 5 16 41 43 14 32 5 STATEMENT: Please tell me if your opinion of each of the following is: Q36: a. US President George W. Bush Americans Russians b. Russian President Vladimir Putin Americans Russians c. Chinese President Hu Jintao Americans Russians very favorable somewhat favorable somewhat unfavorable very unfavorable 20% 3 25% 22 21% 39 30% 20 3 26 33 59 41 7 14 2 2 5 25 37 40 6 23 2 WORLDPUBLICOPINION.ORG & LEVADA CENTER 3 Rus. & Amer. On Iran, Perceptions April 14-24, 2006 [3/4 Sample] Q37. Over the last few years, do you think the effect of Russian foreign policy on the United States and its interests has been * Americans Very positive........................................................... 2% Somewhat positive .................................................49 Somewhat negative ................................................34 Very negative ...........................................................4 (No Answer)...........................................................10 [3/4 Sample] Q38. Over the last few years, do you think the effect of Chinese foreign policy on the United States and its interests has been:* Americans Very positive........................................................... 3% Somewhat positive .................................................33 Somewhat negative ................................................43 Very negative .........................................................11 (No Answer)...........................................................10 [Full Sample] Q37. Over the last few years, do you think the effect of United States foreign policy on Russia and its interests has been † Russians Very positive........................................................... 2% Somewhat positive .................................................20 Somewhat negative ................................................41 Very negative .........................................................15 Neither negative nor positive (vol) ........................12 (No Answer)...........................................................10 Q38. Over the last few years, do you think the effect of Chinese foreign policy on Russia and its interests has been:† Russians Very positive........................................................... 4% Somewhat positive .................................................38 Somewhat negative ................................................17 Very negative ...........................................................6 Neither negative nor positive (vol) ........................19 (No Answer)...........................................................15 [3/4 Sample in US, Full Sample in Russia] * † Asked only to Americans Asked only to Russians WORLDPUBLICOPINION.ORG & LEVADA CENTER 4 Rus. & Amer. On Iran, Perceptions April 14-24, 2006 STATEMENT: How democratic do you think each of the following governments is, on a scale of 0 to 10, with 0 meaning that it is not at all democratic and 10 meaning that it is completely democratic? 4/06 9/05 Q40a. United States Americans .......................................................................... 7.40 Russians ............................................................................. 6.66 6.24 Q40b. Russia Americans .......................................................................... 3.69 Russians ............................................................................. 4.56 3.63 Q40c. China Americans .......................................................................... 2.16 Russians ............................................................................. 4.29 1.89 [Full Sample] STATEMENT: For each of the following, over the last few years, do you think it has become: Q41. more democratic and responsive to its people less democratic and responsive to its people stayed about the same 18% 26 43% 23 33% 31 33 36 24 24 36 27 24 35 18 10 49 18 a. United States Americans Russians b. Russia Americans Russians c. China Americans Russians [3/4 Sample in US, Full Sample in Russia] Q42. As a general rule, do you think the United Nations should or should not actively work to discourage countries from acquiring nuclear weapons? Americans Russians Should ................................................................... 87% 79% Should not ................................................................8 10 (No Answer).............................................................5 10 [3/4 Sample in US, Full Sample in Russia] WORLDPUBLICOPINION.ORG & LEVADA CENTER 5 Rus. & Amer. On Iran, Perceptions Q43. Do you think Iran is or is not trying to develop nuclear weapons? Americans Is............................................................................ 84% Is not.........................................................................9 (No Answer).............................................................7 April 14-24, 2006 Russians 68% 12 20 [3/4 Sample in US, Full Sample in Russia] Q44. If Iran were to develop nuclear weapons, how much would that concern you Americans Russians Very much............................................................. 64% 29% Somewhat...............................................................21 34 A little ......................................................................8 18 Not at all...................................................................4 13 (No Answer).............................................................3 6 [3/4 Sample in US, Full Sample in Russia] Q45 If Iran continues to produce nuclear fuel that could be developed for use in nuclear weapons, do you think that the US should Americans Russians Bomb Iran’s nuclear facilities............................... 24% 7% Pursue a diplomatic approach ................................70 79 (No Answer).............................................................6 14 [3/4 Sample in US, Full Sample in Russia] Q46. If Iran continues to produce nuclear fuel that could be developed for use in nuclear weapons, do you think the UN Security Council should: Americans Russians Vote to impose economic sanctions against Iran if it persists ................................. 68% 23% Continue diplomatic negotiations with Iran ..........................................................26 62 (No Answer).............................................................5 14 [3/4 Sample in US, Full Sample in Russia] Q47. As you may know, Russia’s President Putin has been trying to negotiate a deal whereby Russia would provide fuel for Iran’s nuclear energy program if Iran would agree not to produce nuclear fuel that could be developed for use in nuclear weapons. Do you approve or disapprove of Russia trying to negotiate this deal? Americans Russians Approve................................................................. 44% 46% Disapprove .............................................................49 30 (No Answer).............................................................7 24 Q48-Q49. To be released separately WORLDPUBLICOPINION.ORG & LEVADA CENTER 6 Rus. & Amer. On Iran, Perceptions April 14-24, 2006 US DEMOGRAPHIC DATA: [FULL SAMPLE] 50. Generally speaking, do you think of yourself as a: Republican ..................................................................... 29% Independent.....................................................................16 Democrat.........................................................................32 Other ..............................................................................1.5 No preference..................................................................18 (No answer).......................................................................3 [IF REPUBLICAN ON 50] 51. Would you call yourself a…: Strong Republican ......................................................... 15% Not very strong Republican ............................................14 (No answer).......................................................................3 [IF DEMOCRAT ON 50] 52. Would you call yourself a…: Strong Democrat ............................................................ 18% Not very strong Republican ............................................14 (No answer).......................................................................3 [IF NEITHER DEMOCRAT NOR REPUBLICAN ON 50] 53. Do you think yourself closer to the…: Republican Party.............................................................. 7% Democratic Party ............................................................10 Neither ............................................................................19 (No answer).......................................................................3 [FULL SAMPLE] D1. (Combined Q50 + Q53). Generally speaking, do you think of yourself as a: Republican ..................................................................... 36% Independent.....................................................................22 Democrat.........................................................................42 D2. Age 18-29 ................................................................................. 22% WORLDPUBLICOPINION.ORG & LEVADA CENTER 7 Rus. & Amer. On Iran, Perceptions April 14-24, 2006 30-44 ..................................................................................29 45-59 ..................................................................................28 60+ .....................................................................................22 D3. Education level (categorical) Less than High School ...................................................... 15% High School Graduate........................................................32 Some College .....................................................................28 College Graduate ...............................................................26 D4. Race/Ethnicity White, Non-Hispanic ........................................................ 70% Black, Non-Hispanic..........................................................11 Other, Non-Hispanic ............................................................5 Hispanic .............................................................................13 2+ Races, Non-Hispanic ......................................................1 D5. Gender Male .................................................................................. 48% Female................................................................................52 D6. Region Northeast ........................................................................... 19% Midwest..............................................................................23 South ..................................................................................36 West ...................................................................................23 RUSSIA DEMOGRAPHIC DATA: D1. Age 18-29 ................................................................................. 25% 30-44 ..................................................................................26 45-59 ..................................................................................27 60+ .....................................................................................21 D2. Gender Male .................................................................................. 45% Female................................................................................55 WORLDPUBLICOPINION.ORG & LEVADA CENTER 8 Rus. & Amer. On Iran, Perceptions April 14-24, 2006 METHODOLOGY The poll was fielded by Knowledge Networks, a polling, social science, and market research firm in Menlo Park, California, with a stratified random sample of its large-scale nationwide research panel. This panel itself has been randomly recruited from the national population of households having telephones; households without internet access are subsequently provided with free web access and an internet appliance. Thus the panel is not limited to those who already have home internet access. The distribution of the sample in the Web-enabled panel closely tracks the distribution of United States Census counts for the US population on age, race, Hispanic ethnicity, geographical region, employment status, income, education, etc. Upon survey completion, the data were weighted by gender, age, education, and ethnicity. For more information about the methodology, please go to: www.knowledgenetworks.com/ganp. The Russian survey was conducted by the Levada Center—a research institute in Moscow that follows principles of scientific objectiveness and observes the rules of ESOMAR. The sample generated is a four-stage stratified sample of face-to-face interviews with adult residents aged 18 years or older. Russia is divided into 128 sampling units, which include 86 urban/rural communities with populations greater than 10,000 and 42 rural/urban communities of 10,000 or less. The sample was stratified across regions within Russia, with the specific features of the population’s distribution in each region taken into consideration. Within the subdivided regions that constitute sampling units, households are randomly selected. The respondents within the household are selected by the “last birthday” method—with control of sex-age and sex-education quotas. The sample does not include areas of military conflict, such as the Chechen and Ingush Republics, Dagestan, North Osetia, and difficult to access and sparsely-populated areas. Overall, only 5% of the adult population of Russia resides in these excluded areas. The survey data are coded, entered, cleaned from accidental errors, data omissions and discrepancies and weighted by gender, age, level of education, federal okrug, type of community and voting results in the last national election. WORLDPUBLICOPINION.ORG & LEVADA CENTER 9
