BR Rec. 311-7 Série PN CE 3
advertisement
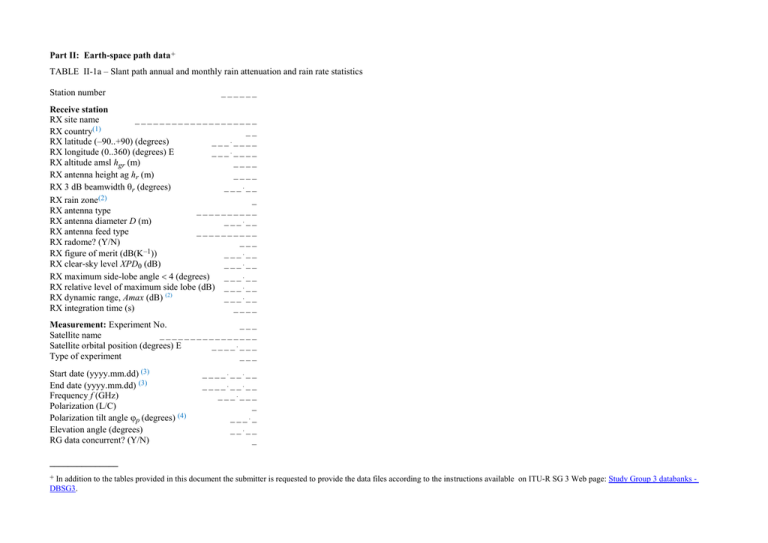
Part II: Earth-space path data+ TABLE II-1a – Slant path annual and monthly rain attenuation and rain rate statistics Station number ______ Receive station RX site name ____________________ RX country(1) __ RX latitude (–90..+90) (degrees) _______ RX longitude (0..360) (degrees) E _______ RX altitude amsl hgr (m) ____ RX antenna height ag hr (m) ____ RX 3 dB beamwidth r (degrees) _____ RX rain zone(2) _ RX antenna type __________ RX antenna diameter D (m) _____ RX antenna feed type __________ RX radome? (Y/N) ___ RX figure of merit (dB(K–1)) _____ RX clear-sky level XPD0 (dB) _____ RX maximum side-lobe angle 4 (degrees) _____ RX relative level of maximum side lobe (dB) _ _ _ _ _ RX dynamic range, Amax (dB) (2) _____ RX integration time (s) ____ Measurement: Experiment No. ___ Satellite name ________________ Satellite orbital position (degrees) E _______ Type of experiment ___ Start date (yyyy.mm.dd) (3) End date (yyyy.mm.dd) (3) Frequency f (GHz) Polarization (L/C) Polarization tilt angle p (degrees) (4) Elevation angle (degrees) RG data concurrent? (Y/N) ________ ________ ______ _ ____ ____ _ _______________ + In addition to the tables provided in this document the submitter is requested to provide the data files according to the instructions available on ITU-R SG 3 Web page: Study Group 3 databanks - DBSG3. Mean Radiating temperature Tmr (K) (5) Data sampling interval (s) Calibration interval (days) Data resolution (dB) Rain gauge type RG resolution (mm/h) RG integration time (s) RG location relative to receiver ____ _______ _____ _______ __________ _______ ____ __________ Table a (6) (7): Rain rate concurrent to attenuation measurements exceeded for percentage of the measurement period, Rc (mm/h) (8) Rain attenuation exceeded for percentage of the measurement period, A (dB) (8) (9) Total attenuation exceeded for percentage of the measurement period, A (dB) (8) (9) Total duration of the experiment for the measurement period (referred to the whole period for annual and worst month statistics or the reference month for monthly statistics), dt (days) (3) Concurrent duration for the measurement period (referred to the whole period for annual and worst month statistics or the reference month for monthly statistics), dc (days) (5) Duration of valid RG data for the measurement period (referred to the whole period for annual and worst month statistics or the reference month for monthly statistics), dr (days) (10) Duration of valid attenuation data for the measurement period (referred to the whole period for annual and worst month statistics or the reference month for monthly statistics), da (days) (8) P0c, Probability that the Rain rate concurrent to attenuation measurements, Rc, exceeds a value of 0.25 mm/h (11) P0a, Probability that the excess attenuation exceeds a value of 0.1 dB (11) Period of year dt (3) Year Worst month Jan Feb Mar Apr May Jun Jul Aug Sep Oct Nov Dec (days) - - - - - - - - - - - - (12) (days) - - - - - - - - - - - - dr (10) (days) - - - - - - - - - - - - da (13) dc (days) - - - - - - - - - - - - P0c (11) (%) - - - - - - - - - - - - P0A (11) (%) - - - - - - - - - - - - R 0.001(8) (12) (mm/h) Aexc 0.001(8) (12)(dB) Atot 0.001(8) (12) (dB) - - - - - - - - - - - - - - R 0.002(8) (12) (mm/h) Aexc 0.002(8) (12)(dB) Atot 0.002(8) (12) (dB) - - - - - - - - - - - - - - R 0.003(8) (12) (mm/h) Aexc 0.003(8) (12)(dB) Atot 0.003(8) (12) (dB) - - - - - - - - - - - - - - R 0.005(8) (12) (mm/h) Aexc 0.005(8) (12)(dB) Atot 0.005(8) (12) (dB) - - - - - - - - - - - - - - R 0.01(8) (12) (mm/h) Aexc 0.01(8) (12) (dB) Atot 0.01(8) (12) (dB) - - - - - - - - - - - - - - R 0.02(8) (12) (mm/h) Aexc 0.02(8) (12) (dB) Atot 0.02(8) (12) (dB) - - - - - - - - - - - - - - R 0.03(8) (12) (mm/h) Aexc 0.03(8) (12) (dB) Atot 0.03(8) (12) (dB) - - - - - - - - - - - - - - R 0.05(8) (12) (mm/h) Aexc 0.05(8) (12) (dB) Atot 0.05(8) (12) (dB) - - - - - - - - - - - - - - R 0.1(8) (12) Aexc 0.1(8) (12) Atot 0.1(8) (12) (mm/h) (dB) (dB) - - - - - - - - - - - - - - R 0.2(8) (12) Aexc 0.2(8) (12) Atot 0.2(8) (12) (mm/h) (dB) (dB) - - - - - - - - - - - - - - R 0.3(8) (12) Aexc 0.3(8) (12) Atot 0.3(8) (12) (mm/h) (dB) (dB) - - - - - - - - - - - - - - R 0.5(8) (12) Aexc 0.5(8) (12) Atot 0.5(8) (12) (mm/h) (dB) (dB) - - - - - - - - - - - - - - R 1(8) (12) Aexc 1(8) (12) Atot 1(8) (12) (mm/h) (dB) (dB) - - - - - - - - - - - - - - R 2(8) (12) Aexc 2(8) (12) Atot 2(8) (12) (mm/h) (dB) (dB) - - - - - - - - - - - - - - R 3(8) (12) Aexc 3(8) (12) Atot 3(8) (12) (mm/h) (dB) (dB) - - - - - - - - - - - - - - R 5(8) (12) Aexc 5(8) (12) Atot 5(8) (12) (mm/h) (dB) (dB) - - - - - - - - - - - - - - R 10(8) (12) Aexc 10(8) (12) Atot 10(8) (12) (mm/h) (dB) (dB) - - - - - - - - - - - - - - R 20(8) (12) Aexc 20(8) (12) Atot 20(8) (12) (mm/h) (dB) (dB) - - - - - - - - - - - - - - R 30(8) (12) Aexc 30(8) (12) Atot 30(8) (12) (mm/h) (dB) (dB) - - - - - - - - - - - - - - R 50(8) (12) Aexc 50(8) (12) Atot 50(8) (12) (mm/h) (dB) (dB) - - - - - - - - - - - - - - R 60(8) (12) Aexc 60(8) (12) Atot 60(8) (12) (mm/h) (dB) (dB) - - - - - - - - - - - - - - R 70(8) (12) Aexc 70(8) (12) Atot 70(8) (12) (mm/h) (dB) (dB) - - - - - - - - - - - - - - R 80(8) (12) Aexc 80(8) (12) Atot 80(8) (12) (mm/h) (dB) (dB) - - - - - - - - - - - - - - R 90(8) (12) Aexc 90(8) (12) Atot 90(8) (12) (mm/h) (dB) (dB) - - - - - - - - - - - - - - R 95(8) (12) Aexc 95(8) (12) Atot 95(8) (12) (mm/h) (dB) (dB) - - - - - - - - - - - - - - R 99(8) (12) Aexc 99(8) (12) Atot 99(8) (12) (mm/h) (dB) (dB) - - - - - - - - - - - - - - R 100(8) (12) (mm/h) Aexc 100(8) (12) (dB) Atot 100(8) (12) (dB) - - - - - - - - - - - - - - Comments (15): References: (16) Instructions, definitions and notes: (1) Use ISO 3166-1 alpha-2 country codes. (2) The values of attenuation measured during deep fades higher than the dynamic range of the receiver, Amax, should be considered as valid and set equal to Amax. The information provided for reference should describe the characteristics of the equipment and how the dynamic range was estimated. (4) Tilt angle is referred to polarisation tilt angle with respect to the local horizontal plane. (5) In the case of measurements of total attenuation performed using a ground microwave radiometer, the information provided for reference should describe the characteristics of the radiometer and the procedure used to derive the parameters for the retrieval of the total attenuation from measurements of atmospheric sky noise (e.g. Tmr). The information provided for reference should also describe the procedures for the calibration of the radiometer and their results. (6) It is requested to provide distributions of measurement periods lasting at least one year or multiple complete years. In the case where the measurement period includes multiple years, it is requested to provide the distributions of individual years ( 12 consecutive months) and the distribution of the complete measurement period (multiple of 12 months). (7) Submissions should comply with the acceptance criteria specified in Rec. ITU-R P.311. In particular measurements of rain rate and attenuation should be strictly concurrent. (8) The exceedance percentage shall be calculated as the ratio between the exceedance time and the total amount of time during the which the experiment was performed from the start of the experiment to its end, dt (4). For example, in an experiment starting on 2001/1/1 and ending on 2001/12/31 (i.e. dt=365 days) with an exceedance time of 63072 s, the exceedance percentage shall be the ratio between 63072 s and 365 x 24 x 3600 s (i.e. 0.2 %). The monthly exceedance percentage shall be calculated as the ratio between the exccedance time during the month and the total amount of time in the during the which the experiment was performed from the start of the experiment to its end, dt (4). For example in an experiment starting on 2001/1/1 and ending on 2002/12/31 with an exceedance time of 10000 s in the months of April (in this case dt is equal to 60 days ), the exceedance percentage in the month of April shall be the ratio between 10368 s and 60 x 24 x 3600 s (i.e. 0.2 %). The experimenter shall not normalise using the total duration of valid concurrent data, dc (5) (9) For versions of this table published before 2014, this parameter was defined as percentage of year. (10) The duration of valid rain gauge data, dr, is the total time of valid rain measurements during the total period of the measurements, expressed in days as a real number (e.g. 342.532 day). This parameter does not take into account concurrency of rain and attenuation data. The duration of valid rain gauge data in month N, drm, is the total time of valid rain measurements in month N during the total period of the measurements in month N, expressed in days as a real number (e.g. dr could be 59.5 day). (11) The threshold values indicated in table a, 0.25 mm/h and 0.1 dB for Poc and Poa respectively, have been derived from the sensitivity of commonly used equipment. (12) Concurrent duration, dc, is the total time of valid concurrent rain and attenuation measurements during the total period of measurements, dt, expressed in days as a real number (e.g. 339.888 days). for cases where the duration of valid raingauge data, rd, is lower than the duration of valid attenuation data , da, then the experimenter should provide two separate set of tables, one generated using concurrent valid raingauge data and the other generated without considering the raingauge data but only the attenuation data. The availability of valid samples (%) is given by the ratio between the concurrent duration, dc, and the total duration of the experiment, dt (2). For example an experiment starting on 2001/1/1 and ending on 2001/12/31, with an amount of valid data corresponding to 93.12 %, the duration parameter dc, shall indicate = 339.888 days. Concurrent duration in month N, dc, is the total time of valid concurrent rain and attenuation measurements in month N during the total period of measurements in month N, dt, expressed in days as a real number (e.g. for the two examples provided in (3) dc could be 58.890 and 83.4275 days, respectively ). For cases where the duration valid raingauge data in month N, dr, is lower than the duration of valid attenuation data during the same month, da, the experimenter should provide two separate tables, one generated using concurrent valid raingauge data and the other generated without considering the raingauge data but only the attenuation data. The availability of valid samples (%) in month N is given by the ratio between the concurrent duration, dc in month N, and the total duration of the experiment in month N, dt (15). For example an experiment starting on 2001/1/1 and ending on 2002/12/31, with an amount of valid data in the months of April during this period corresponding to 98.15 % of the total period of measurements in April, dt equal 60, the concurrent duration parameter dc, shall indicate = 58.890 days. (13) The duration of valid attenuation data, da, is the total time of valid attenuation measurements during the total period of the measurements, expressed in days as a real number (e.g. 339.888 day). This parameter does not take into account concurrency of rain and attenuation data. The duration of valid attenuation data in month N, da, is the total time of valid attenuation measurements in month N during the total period of the measurements in month N, expressed in days as a real number (e.g. da could be 58.890 day). (14) Values must be positive but the Table Keeper can put a minus sign in fornt of data not valid for testing. (15) For measurements of excess attenuation the information provided for reference should describe in ‘Comments’ the procedure used to derive the 0 dB reference level (i.e. by using a radiometer or by using signal levels before and after the event, etc.) (16) This field should indicate the reference documents that provide the detailed description of the experiment. These documents shall be available to SG3/WPs participants (e.g. input document for SG3, journal or international conference)
