Graphs and Graphing Utilities
advertisement
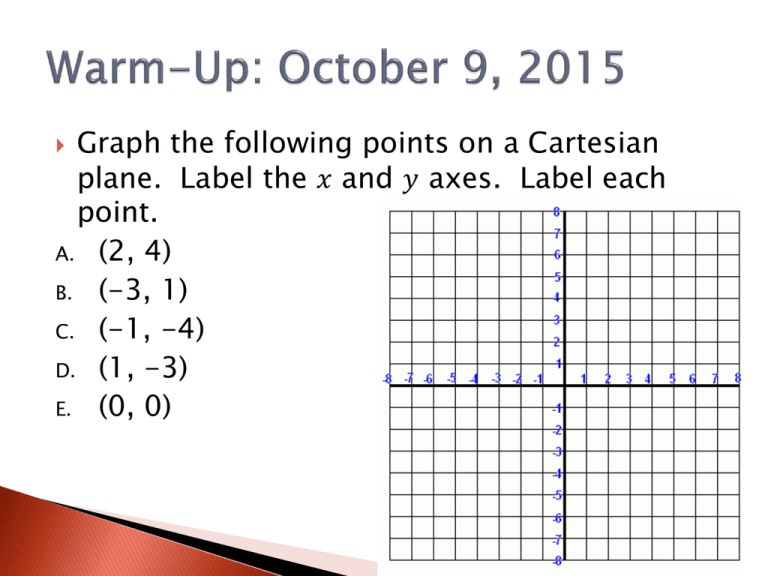
Graph the following points on a Cartesian
plane. Label the 𝑥 and 𝑦 axes. Label each
point.
A. (2, 4)
B. (-3, 1)
C. (-1, -4)
D. (1, -3)
E. (0, 0)
Section 1.1
How can we graph functions?
Named after French mathematician René
Descarte.
Also called Cartesian Coordinate System
Also called Rectangular Coordinate System
Has an x-axis and y-axis
The origin is the intersection of the axes
The axes divide the plane into four quadrants
Each point corresponds to an ordered pair of
two real numbers (x, y)
For a given equation, the graph is the set of
all points whose coordinates satisfy the
equation.
One method for graphing is the pointplotting method
◦ Identify the basic shape of the graph, based on the
equation
◦ Pick an 𝑥 value
◦ Substitute it into the equation
◦ Simplify to get the 𝑦 value
◦ Plot the 𝑥, 𝑦 on a Cartesian plane
◦ Continue plotting points until you have enough to
see what the graph looks like
◦ Connect the dots
◦ Draw arrows if the graph continues
Graph 𝑦 = 𝑥 2 + 2𝑥 − 3
Graph 𝑦 = 𝑥 2 − 4𝑥 − 5
The 𝒙-intercept is where the graph crosses
the 𝑥-axis. The point is (𝑥-intercept, 0)
The 𝒚-intercept is where the graph crosses
the 𝑦-axis. The point is (0, 𝑦-intercept)
Page 121 #1-45 Every Other Odd
You MUST use graph paper.
In Exercises 1-12, plot the given point in a
rectangular coordinate system.
1) 1,4 5) 3,5 9) 4,0
Graph each equation in Exercises 13-28. Let
x={-3, -2, -1, 0, 1, 2, 3}.
2
13)
y x 2
17)
y 2x 1
21)
y x
25)
y 4 x
2
