algebra2help
advertisement

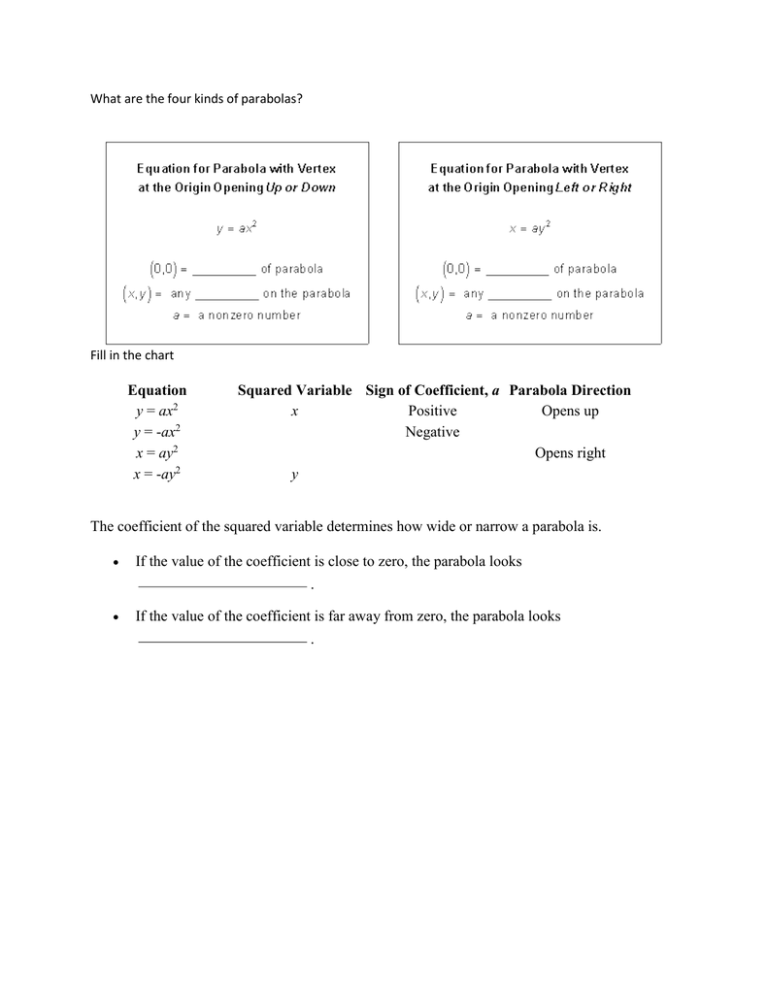
What are the four kinds of parabolas?
Fill in the chart
Equation
y = ax2
y = -ax2
x = ay2
x = -ay2
Squared Variable Sign of Coefficient, a Parabola Direction
x
Positive
Opens up
Negative
Opens right
y
The coefficient of the squared variable determines how wide or narrow a parabola is.
If the value of the coefficient is close to zero, the parabola looks
.
If the value of the coefficient is far away from zero, the parabola looks
.
How to Find the Value of the Coefficient a
Opening Up or Down:
Subtract the y-value of the parabola at the vertex from the y-value of the point on the
parabola that is 1 unit to the
of the vertex.
Opening Left or Right:
Subtract the x-value of the parabola at the vertex from the x-value of the point on the
parabola that is 1 unit to the
the vertex.
Vertex:
Point 1 unit to the right of the vertex:
Equation:
Opening Up or Down:
Opening Left or Right:
y = 4(x - 2)2 - 1
How to Convert Vertex Form to Standard
Form
1.
2.
3.
4.
Start with the simplified equation.
Use FOIL to expand the squared term.
Distribute the coefficient, a.
Simplify.
11) Use the steps to convert the parabola equation to vertex form.
How to Convert Standard Form to Vertex
Form
1.
2.
3.
4.
5.
Start with the simplified equation.
Isolate the x-terms.
Complete the square.
Factor the x-term trinomial.
Isolate y.
y = 2x2 + 4x + 3
nonlinear equation: an equation whose graph is not a
.
nonlinear system of equations: two or more equations that are solved together, where at least
one equation is
and the equations have at least
variables.
solution set of a nonlinear system of equations: all the x- and y-values that make all the
equations in the system
system
; all the points where the graphs of all the equations in the
.
Use the description below each axis to sketch a nonlinear system of two equations with the given
number of solutions.
This system has no solution because the two
graphs never intersect.
This system has one solution because the two
graphs intersect at exactly one point.
This graph has several solutions because the
two graphs intersect at several points.
This system has infinite solutions because the
two graphs overlap. All of their points intersect.
How to Use Substitution to Solve a Nonlinear System of Equations
Step 1: Choose the variable to
Choose a variable in a linear equation.
. (This will be the variable you substitute.)
OR
Choose a variable that is
in both equations.
Step 2: Use inverse operations to isolate that
Step 3:
the isolated variable into the other equation in the system.
Step 4: Now that equation has one variable. Solve the
Step 5:
.
for that variable.
your solutions into any of the original equations in the system.
Step 6: Solve that
for your second variable.
Step 7: Check your solutions.
all solutions into every equation in the system and verify they are true.
OR
all the equations and verify that every solution is a point of intersection.
4) Use the steps above to solve this system of equations. Show your work.
Fill in the blanks to complete the chart.
Symbols
Graphs
Solution set
for one
Nonlinear equation
Nonlinear inequality
=
,
,
,
,
Curve and shading
All the points that make the inequality
Curve
All the points that make the equation
The points where the graphs
The shaded regions where the graphs
Solution set
for a system
2) In the graph of a nonlinear inequality, the xy-plane is divided into two regions.
1. Shaded: All the points that are
2. Unshaded: All the points that are not
3) The boundary between the two regions is the curve.
1. Solid curve: If the inequality has
or
2. Dashed curve: If the inequality has
, the boundary is solid.
or
, the boundary is dashed.
4) Fill in the blanks to complete the steps.
How to Graph a Nonlinear Inequality
Step 1: Change the inequality sign to an
sign.
Step 2: Graph the equation.
Use a dashed curve for
Use a solid curve for
or
or
.
.
Step 3: Choose test points.
Circle, ellipse, or parabola: Choose a point inside the curve.
Hyperbola: Choose a point between the two curves.
Step 4: Determine if that point makes the inequality true.
If yes, shade the region that contains your test
If no, shade the region that does not contain the test
5) Follow the instructions to describe and complete each graph.
.
.
The graph at right is for the hyperbola with the
equation
.
Which points satisfy the inequality
?
Shade the graph to show this inequality.
Write an equation that defines the circle
graphed at right.
Origin:
Radius:
Equation:
Write an inequality that defines the circle
graphed at right.
The boundary curve is
The shaded region is
circle.
Inequality:
Write function or relation in each blank.
.
the
2) Write input or output in each blank.
MAPPING DIAGRAMS
Show how a function or relation assigns
The left side shows all possible
The right side shows all possible
The arrows connect
values to
values.
values.
values.
s to their
s.
3) Answer each question about mapping diagrams.
1. How can you tell when a mapping diagram shows a relation that is not a function?
2. How can you tell when a mapping diagram shows a function?
3. How many ordered pairs can be written for each arrow?
4) Draw arrows on each mapping diagram below to match its title. List the ordered pairs to the
right of the diagram.
A Relation That Is a Function
A Relation That Is Not a Function
5) Write x or y in each blank.
GRAPHS
Show a function or relation plotted as ordered pairs: (
The
-axis usually shows the independent variable.
The
-axis usually shows the dependent variable.
If all the ordered pairs have different
-values, the graph shows a function.
The graph of a function never has two different points with the same
-coordinate.
6) Answer each question about graphs and function.
1. What test can you use to decide if a graph is a function?
2. How does this test work?
,
).
7) Tell whether or not each graph shows a function. Circle the correct answer.
Function or Not a Function
Function or Not a Function
Function or Not a Function
Function or Not a Function
Write domain or range in each blank.
The
of a function is the set of all values it will accept as inputs.
The
of a function is the set of all outputs it will return as outputs.
2) Fill in the blanks to complete the chart.
How to Find Domain and Range
Domain
Use a mapping
diagram
Find all values in the
oval that are connected to arrows
Range
Find all values in the
oval that are connected to arrows
Use ordered pairs
Find all the
-coordinates.
Find all the
-coordinates.
Use a graph
Study all
-values on the graph. Study all
3) Find the domain and range of each function.
-values on the graph.
Ordered Pairs for F(x)
(1, 4), (2, 7), (5, 1), (6, 3)
Domain: {
,
,
,
} Domain: {
,
,
Range: {
,
,
}
Range: {
4) Estimate the domain and range of each graphed function.
,
,
Domain:
Domain:
Domain:
Range:
Range:
Range:
5)
How to Use an Equation to find the Domain of a Function
,
,
}
}
Look for any
values that the equation will not accept.
6) Fill in the blanks to find the domain of each function.
F(x) =
F(x) =
You cannot divide by
You cannot have a
.
So,
cannot be an input for this function. this function.
Domain: all real numbers except
Domain: all
x < 0 and x > 0
square root.
numbers cannot be inputs for
So,
numbers
x≥0
1) Write input or output in each blank.
Write domain or range in each blank.
2) For a number b to be in the domain of a composite function G(F(x)):
1. The input, b, must be in the
2. The output, F(b), must be in the
.
.
3) Use the steps to find the domain of the composite function G(F(x)).
How to Find the Domain of G(F(x))
1. Find the range of the first function.
2. Find the domain of the second function.
Write it as an equation or inequality.
3. Substitute the value expression of the
1. Range of F(x) = All
numbers
2. Domain of G(y) = All
numbers
Domain of G(y): y ≥ 0
3. 2 - x ≥ 0
4. x ≤ 2
first function into the domain of the
second function.
4. Simplify.
Domain of G(F(x)): All real numbers less than
or equal to
4) Use the steps to find the domain of the composite function G(F(x)).
1. Domain of F(x) = All numbers greater
How to Find the Domain of G(F(x))
1. Find the domain of the first function.
2. Write it as an equation or inequality and
simplify.
3. Find the domain of the second function.
4. Write it as an equation or inequality and
simplify.
5. Combine the results from steps 2 and 4.
than or equal to
2. x ≥ 0
3. Domain of G(y) = All numbers except
4.
5. Domain of G(F(x)): All numbers
greater than or equal to
except
.
1) Fill in the blanks to complete the list of answers.
What happens when you graph the inverse of a function?
The graph is
The x- and y-coordinates of each point are
The y-values become the inputs — the
The
over the line y = x.
.
variable.
-axis becomes the horizontal axis.
2) Fill in the blanks to complete the chart.
Vertical Line Test
Purpose
How It Works
Horizontal Line Test
To tell if the
of a
graphed function is a function.
If any vertical line intersects a graph
If any horizontal line intersects a
at only one point, the graph represents function's graph at only one point, the
To tell if a graph is a
a
.
.
of that function is also
a function.
3) Write the ordered pairs for the inverse of the square root function. Then graph the inverse.
FUNCTION INVERSE
F(x) = x2
F-1(x) =
(y, x)
(x, y)
(-2, 4)
(-1, 1)
(0, 0)
(1, 1)
(2, 4)
4) Is the inverse of F(x) = x2 a function? Explain.
1) Fill in the blanks to complete the list.
Shifting Functions
Shifting a function is
The graph's
A function can shift
a function around the xy-plane.
changes, but its shape does not change.
(up or down) or
(left or right).
2) Fill in the blanks to complete the chart.
Shift
How the graph changes
How the equation changes
Example:
F(x) = x2
Up
Down
Left
Moves up along the
-axis
Moves down along the
-axis
Moves left along the
-axis
Moves right along the
a number to the
entire function
F(x) = x2 + 1
a number from the
entire function
F(x) = x2 – 1
a number to each
x in the function
a number from
each x in the function
-axis
3) Each graph below shows the function F(x) = x2 shifted.
Tell which direction each is shifted and how many units.
Right
F(x) = (x + 1)2
F(x) = (x – 1)2
4) Each graph below shows the function F(x) = x2 shifted.
Use the graph and its description to write the equation for the shifted function G(x).
Shifted down 1 unit and to the right 2 units
Equation:
Shifted up 3 units and to the left 1 unit
Equation:


