Quadratics - TaiSee Island
advertisement
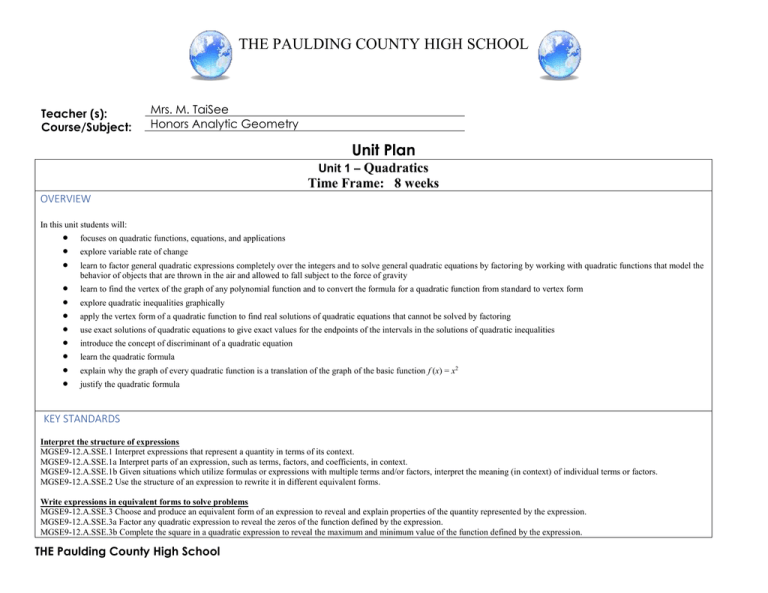
THE PAULDING COUNTY HIGH SCHOOL Teacher (s): Course/Subject: Mrs. M. TaiSee Honors Analytic Geometry Unit Plan Unit 1 – Quadratics Time Frame: 8 weeks OVERVIEW In this unit students will: focuses on quadratic functions, equations, and applications explore variable rate of change learn to factor general quadratic expressions completely over the integers and to solve general quadratic equations by factoring by working with quadratic functions that model the behavior of objects that are thrown in the air and allowed to fall subject to the force of gravity learn to find the vertex of the graph of any polynomial function and to convert the formula for a quadratic function from standard to vertex form explore quadratic inequalities graphically apply the vertex form of a quadratic function to find real solutions of quadratic equations that cannot be solved by factoring use exact solutions of quadratic equations to give exact values for the endpoints of the intervals in the solutions of quadratic inequalities introduce the concept of discriminant of a quadratic equation learn the quadratic formula explain why the graph of every quadratic function is a translation of the graph of the basic function f (x) = x2 justify the quadratic formula KEY STANDARDS Interpret the structure of expressions MGSE9-12.A.SSE.1 Interpret expressions that represent a quantity in terms of its context. MGSE9-12.A.SSE.1a Interpret parts of an expression, such as terms, factors, and coefficients, in context. MGSE9-12.A.SSE.1b Given situations which utilize formulas or expressions with multiple terms and/or factors, interpret the meaning (in context) of individual terms or factors. MGSE9-12.A.SSE.2 Use the structure of an expression to rewrite it in different equivalent forms. Write expressions in equivalent forms to solve problems MGSE9-12.A.SSE.3 Choose and produce an equivalent form of an expression to reveal and explain properties of the quantity represented by the expression. MGSE9-12.A.SSE.3a Factor any quadratic expression to reveal the zeros of the function defined by the expression. MGSE9-12.A.SSE.3b Complete the square in a quadratic expression to reveal the maximum and minimum value of the function defined by the expression. THE Paulding County High School THE PAULDING COUNTY HIGH SCHOOL Create equations that describe numbers or relationships MGSE9-12.A.CED.1 Create equations and inequalities in one variable and use them to solve problems. Include equations arising from quadratic functions. MGSE9-12.A.CED.2 Create quadratic equations in two or more variables to represent relationships between quantities; graph equations on coordinate axes with labels and scales. MGSE9-12.A.CED.4 Rearrange formulas to highlight a quantity of interest using the same reasoning as in solving equations. Solve equations and inequalities in one variable MGSE9-12.A.REI.4 Solve quadratic equations in one variable. MGSE9-12.A.REI.4a Use the method of completing the square to transform any quadratic equation in x into an equation of the form (x – p)2 = q that has the same solutions. Derive the quadratic formula from ax2 + bx + c = 0. MGSE9-12.A.REI.4b Solve quadratic equations by inspection (e.g., for x2 = 49), taking square roots, factoring, completing the square, and the quadratic formula, as appropriate to the initial form of the equation (limit to real number solutions). Interpret functions that arise in applications in terms of the context MGSE9-12.F.IF.4 Using tables, graphs, and verbal descriptions, interpret the key characteristics of a function which models the relationship between two quantities. Sketch a graph showing key features including: intercepts; interval where the function is increasing, decreasing, positive, or negative; relative maximums and minimums; symmetries; and end behavior. MGSE9-12.F.IF.5 Relate the domain of a function to its graph and, where applicable, to the quantitative relationship it describes. MGSE9-12.F.IF.6 Calculate and interpret the average rate of change of a function (presented symbolically or as a table) over a specified interval. Estimate the rate of change from a graph. Analyze functions using different representations MGSE9-12.F.IF.7 Graph functions expressed algebraically and show key features of the graph both by hand and by using technology. MGSE9-12.F.IF.7a Graph quadratic functions and show intercepts, maxima, and minima (as determined by the function or by context). MGSE9-12.F.IF.8 Write a function defined by an expression in different but equivalent forms to reveal and explain different properties of the function. MGSE9-12.F.IF.8a Use the process of factoring and completing the square in a quadratic function to show zeros, extreme values, and symmetry of the graph, and interpret these in terms of a context. MGSE9-12.F.IF.9 Compare properties of two functions each represented in a different way (algebraically, graphically, numerically in tables, or by verbal descriptions). Build a function that models a relationship between two quantities MGSE9-12.F.BF.1 Write a function that describes a relationship between two quantities. MGSE9-12.F.BF.1a Determine an explicit expression and the recursive process (steps for calculation) from context. Build new functions from existing functions MGSE9-12.F.BF.3 Identify the effect on the graph of replacing f(x) by f(x) + k, k f(x), f(kx), and f(x + k) for specific values of k (both positive and negative); find the value of k given the graphs. Experiment with cases and illustrate an explanation of the effects on the graph using technology. Include recognizing even and odd functions from their graphs and algebraic expressions for them. Construct and compare linear, quadratic, and exponential models and solve problems MGSE9-12.F.LE.3 Observe using graphs and tables that a quantity increasing exponentially eventually exceeds a quantity increasing linearly, quadratically, or (more generally) as a polynomial function. MGSE9-12.S.ID.6 Represent data on two quantitative variables on a scatter plot, and describe how the variables are related. MGSE9-12.S.ID.6a Decide which type of function is most appropriate by observing graphed data, charted data, or by analysis of context to generate a viable (rough) function of best fit. Use this function to solve problems in context. SUB-STANDARDS THE Paulding County High School THE PAULDING COUNTY HIGH SCHOOL 1. 2. 3. 4. 5. 6. 7. 8. Make sense of problems and persevere in solving them. Reason abstractly and quantitatively. Construct viable arguments and critique the reasoning of others. Model with mathematics. Use appropriate tools strategically. Attend to precision. Look for and make use of structure. Look for and express regularity in repeated reasoning. ENDURING UNDERSTANDINGS The graph of any quadratic function is a vertical and/or horizontal shift of a vertical stretch or shrink of the basic quadratic function f (x) = x2. The vertex of a quadratic function provides the maximum or minimum output value of the function and the input at which it occurs. Every quadratic equation can be solved using the Quadratic Formula. ESSENTIAL QUESTIONS 1. 2. 3. 4. 5. 6. 7. 8. 9. 10. 11. 12. 13. 14. How is a relation determined to be quadratic? Are all quadratic expressions factorable? How do the factors of a quadratic functions yield the zeros for that function? Where is the maximum or minimum value of a quadratic equation located? How is the quadratic formula developed by completing the square? How can the quadratic formula be used to find the zeros of a quadratic function? What information can be gleaned from the table of values and the graph of a relation? Under what circumstances can one take the square root of both sides of the equation? What is the difference between a quadratic equation and a quadratic inequality? What does the domain of a function tell about the quantitative relationship of the given data? How many solutions exist for the system of equations consisting of a linear and a quadratic equation? How is the rate of change for a quadratic function different from the rate of change for a linear function? How can the graph of f(x) = x2 move left, right, up, down, stretch, or compress? What are the relative advantages and disadvantages of solving a quadratic function by factoring, completing the square, quadratic formula, or taking the square root of both sides? CONCEPTS/SKILLS TO MAINTAIN It is expected that students will have prior knowledge/experience related to the concepts and skills identified below. It may be necessary to pre-assess in order to determine if time needs to be spent on conceptual activities that help students develop a deeper understanding of these ideas. 1. 2. Use Function Notation Put data into tables THE Paulding County High School THE PAULDING COUNTY HIGH SCHOOL 3. 4. 5. 6. 7. 8. 9. Graph data from tables Solve one variable linear equations Determine domain of a problem situation Solve for any variable in a multi-variable equation Recognize slope of a linear function as a rate of change Graph linear functions Graph inequalities SELECTED TERMS AND SYMBOLS The following terms and symbols are often misunderstood. These concepts are not an inclusive list and should not be taught in isolation. However, due to evidence of frequent difficulty and misunderstanding associated with these concepts, instructors should pay particular attention to them and how their students are able to explain and apply them. The definitions below are for teacher reference only and are not to be memorized by the students. Students should explore these concepts using models and real life examples. Students should understand the concepts involved and be able to recognize and/or demonstrate them with words, models, pictures, or numbers. The website below is interactive and includes a math glossary. http://intermath.coe.uga.edu/dictnary/homepg.asp Definitions and activities for these and other terms can be found on the Intermath website. Links to external sites are particularly useful. Formulas and Definitions: Complete factorization over the integers: Writing a polynomial as a product of polynomials so that none of the factors is the number 1, there is at most one factor of degree zero, each polynomial factor has degree less than or equal to the degree of the product polynomial, each polynomial factor has all integer coefficients, and none of the factor polynomial can written as such a product. Completing the Square: Completing the Square is the process of converting a quadratic equation into a perfect square trinomial by adding or subtracting terms on both sides. Difference of Two Squares: a squared (multiplied by itself) number subtracted from another squared number. It refers to the identity algebra. Horizontal shift: A rigid transformation of a graph in a horizontal direction, either left or right. Perfect Square Trinomial: A trinomial that factors into two identical binomial factors. Quadratic Equation: An equation of degree 2, which has at most two solutions. Quadratic Function: A function of degree 2 which has a graph that “turns around” once, resembling an umbrella-like curve that faces either right-side up or upside down. This graph is called a parabola. Root: The x-values where the function has a value of zero. Standard Form of a Quadratic Function: ax 2 bx c Vertex: The maximum or minimum value of a parabola, either in terms of y if the parabola is opening up or down, or in terms of x if the parabola is opening left or right. Vertex form of a quadratic function: A formula for a quadratic equation of the form o f (x) = a (x – h)2 + k, where a is a nonzero constant and the vertex of the graph is the point (h, k). Theorems: For h a 2 b2 a b a b in elementary b and b , f (x) = a (x – h)2 + k is the same function as f (x) = ax2 + bx + c. k f 2a 2a The graph of any quadratic function can be obtained from transformations of the graph of the basic function f (x) = x2. THE Paulding County High School THE PAULDING COUNTY HIGH SCHOOL Quadratic formula: The solution(s) of the quadratic equation of the form ax2 bx c 0 , where a, b, and c are real numbers with a 0 , is x b b 2 4ac . 2a The discriminant of a quadratic equation is positive, zero, or negative if and only if the equation has two real solutions, one real solution, or two complex conjugate number solutions respectively. EVIDENCE OF LEARNING By the conclusion of this unit, students should be able to demonstrate the following competencies: 1. 2. 3. 4. 5. 6. Given raw data, graph and interpret a quadratic function. Given raw data, graph and interpret a quadratic inequality. Translate the graph of f(x) = x2 as directed. Determine and use the most advantageous method of finding the zeros of a quadratic equation or inequality. Determine the variable rate of change of a quadratic function. Model data by finding intercepts, relative maxima and minima, and other important information. THE Paulding County High School

