File
advertisement

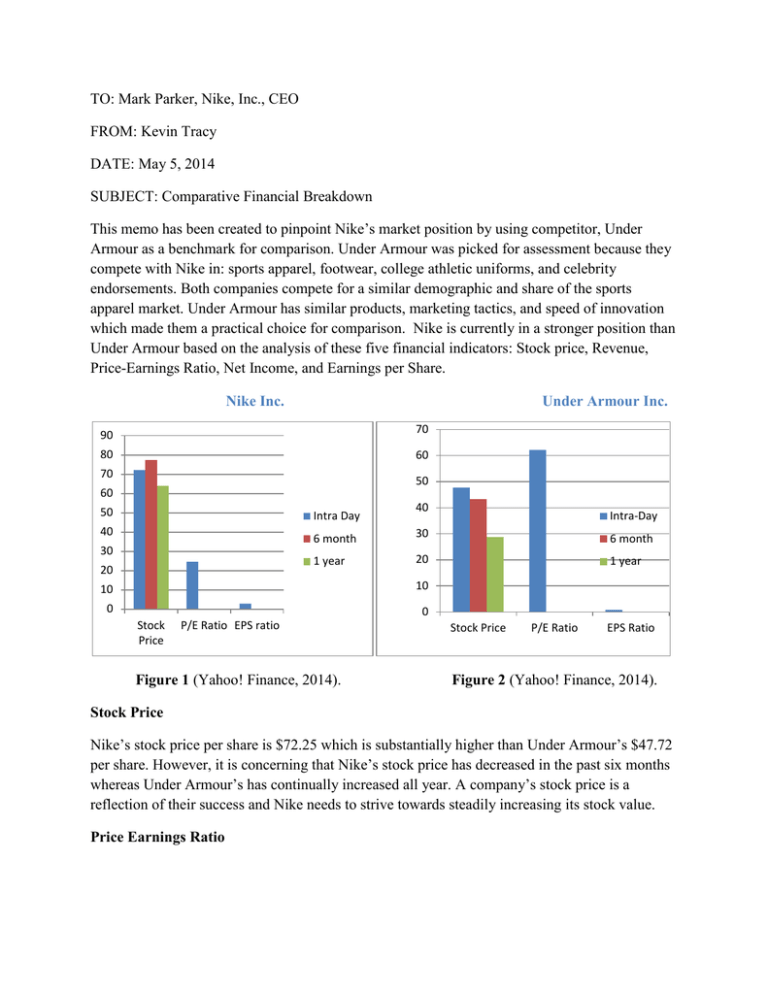
TO: Mark Parker, Nike, Inc., CEO FROM: Kevin Tracy DATE: May 5, 2014 SUBJECT: Comparative Financial Breakdown This memo has been created to pinpoint Nike’s market position by using competitor, Under Armour as a benchmark for comparison. Under Armour was picked for assessment because they compete with Nike in: sports apparel, footwear, college athletic uniforms, and celebrity endorsements. Both companies compete for a similar demographic and share of the sports apparel market. Under Armour has similar products, marketing tactics, and speed of innovation which made them a practical choice for comparison. Nike is currently in a stronger position than Under Armour based on the analysis of these five financial indicators: Stock price, Revenue, Price-Earnings Ratio, Net Income, and Earnings per Share. Nike Inc. Under Armour Inc. 70 90 80 60 70 50 60 50 Intra Day 40 30 20 40 Intra-Day 6 month 30 6 month 1 year 20 1 year 10 10 0 0 Stock Price P/E Ratio EPS ratio Figure 1 (Yahoo! Finance, 2014). Stock Price P/E Ratio EPS Ratio Figure 2 (Yahoo! Finance, 2014). Stock Price Nike’s stock price per share is $72.25 which is substantially higher than Under Armour’s $47.72 per share. However, it is concerning that Nike’s stock price has decreased in the past six months whereas Under Armour’s has continually increased all year. A company’s stock price is a reflection of their success and Nike needs to strive towards steadily increasing its stock value. Price Earnings Ratio P/E ratio is the only category in which Under Armour is outperforming Nike. Under Armour boasts a 62.14 P/E ratio while Nike’s is less than half at 24.67. Having a high Price Earnings ratio is an indicator of profitability and attracts stockholders to confidently purchase more shares. Earnings per Share Ratio Nike has a commanding lead in the market with an impressive EPS ratio of 2.93 which is almost triple of Under Armour’s 0.77 EPS ratio. Earnings per share ratio is an important variable in determining what a stock’s value is worth and it is reassuring to see that Nike’s high EPS ratio is reflective of its high stock price. Revenue and Net Income Nike’s Revenue Under Armour’s Revenue Nike’s Net Income Under Armour’s Net Income 27.07B 2.50B 2.70B 167.89M Table 1 (Yahoo! Finance, 2014). Revenue and Net Income As shown in Table 1, Nike has a considerable advantage in both net income and revenue. These variables represent the bottom-line and it is evident that Nike is the more profitable company. Comparative Review After analyzing the stock prices, P/E ratio, Earnings per Share ratio, Revenue, and Net income of both companies it is evident that Nike holds a commanding lead over Under Armour in the sports apparel market. However, the only financial variable in which Nike does not outperform Under Armour is its P/E ratio. On the other hand, P/E ratios can be deceiving because they are volatile and subject to change quickly. In the end, Nike currently holds a very strong position in the sports apparel market relative to Under Armour and a shift in the market share is highly unlikely at this point in time. References Yahoo! Finance. (2014, May 6). Nike Inc. Key Statistics. Retrieved May 6, 2014, from Yahoo! Finance: http://finance.yahoo.com/q/ks?s=NKE+Key+Statistics Yahoo! Finance. (2014, May 6). Under Armour Inc. Key Statistics. Retrieved May 6, 2014, from Yahoo! Finance: http://finance.yahoo.com/q/ks?s=UA+Key+Statistics


