Introduction
advertisement
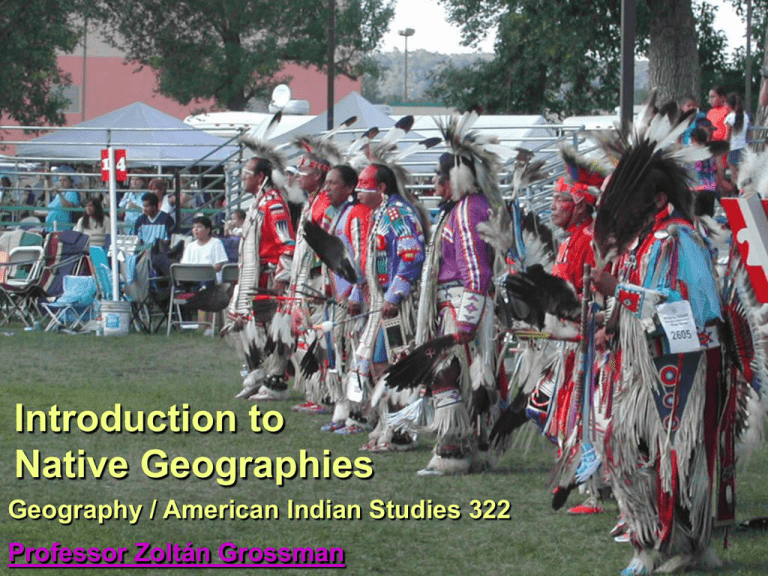
Introduction to Native Geographies Geography / American Indian Studies 322 Professor Zoltán Grossman There goes the neighborhood… No “Indians” before 1492 Diversity in… Tribes/bands Languages Governments Cultures Spiritual beliefs Resource use Land control Pros & Cons of Terms American Indian or Indian Native American or Native Aboriginal First Nations 4th World Amerindian Tribal Autochthonous Indigenous Nation names Native Americans • Racial category? (“minority”) • Ethno-cultural groups • Economic status • Groups with a land base • Autonomous nations Tribal Diversity Cultural Areas Arctic Subarctic Northwest Coast Plateau Great Basin California Plains Southwest Southeast Northeast xxxxx Major Early Language & Cultural Groups Eastern U.S. language groups xxxxx Algonquian Algonquian Siouan Caddoan Iroquoian Gulf (Muskogean) Timucua Algonquian Siouan Iroquoian Algonquian Iroquoian Caddoan Gulf Timucua Western U.S. language groups xxxxxSalish Penutian Algonquian Siouan Algonquian Siouan Caddoan Aztec-Tanoan Athabascan (Southern) Salish Penutian Hokan Keres Athabascan Siouan Hokan Penutian Caddoan AztecTanoan Algonquian Athabascan Hokan AztecTanoan Keres AztecTanoan Caddoan Athabascan Hokan Alaska language groups xxxxx Inuit Inuit Dené Dené (Northern Athabascan) Inuit Inuit Inuit (Eskimo) Dené Aleut Aleut Aleut Canada language groups Algonquian Dené (Athabascan) Inuit Siouan Iroquoian Salish Wakashan xxxxx Inuit Dené Inuit Dené Inuit Dené Dené Wakashan Salish Inuit Inuit Algonquian Algonquian Siouan Algonquian Tsimshian Kootenai Algonquian Iroquoian Native Land Losses Studying Native History/Geography • Not only about racial conflict, but the colonization of nations • Not only about the U.S. government, but the origins of the United States • Not only about federal/state policies, but the land base where they occur • Not only looks at political/economic, but at European cultural underpinnings xxxx Who is an “Indian”? • Ancestors lived in America, before the arrival of Europeans. • Who is considered to be an Indian by the community. • Who self-defines as an Indian. • Federal court decisions have shifted definitions over time Blood Quantum (% of tribal ancestry) • Pushed by federal Bureau of Indian Affairs (1/4) • Tribal govt’s set today (often internalized) • Intermarriage can “fractionalize” tribe Racial Complexities •Native Americans can “appear” white, black, etc. •Multiracial tribal nations -Seminole, Lumbee, etc. •Mixed categories -Métis (French), -Mestizo (Spanish), etc. Who is an “Indian”? Categories Defined by…. What about… RACIAL Blood Quantum (biology) “Mixed bloods,” Assimilated CULTURAL Tribally raised/accepted Adopted Indians, White ‘wannabes’ GEOGRAPHICAL Reservation residents Urban Indians, Rez whites “Racial composition is not always dispositive in determining who are Indians for the purposes of Indian law. In dealing with Indians, the federal government is dealing with members or descendants of political entities, that is, Indian tribes, not with persons of a particular race. Tribal membership as determined by the Indian tribe or community itself is often an essential element.” — Handbook of Federal Indian Law Top 10 Things to Say to a White Person Upon First Meeting 10. How much white are you? 9. I’m part white myself, you know. 8. I learned all your people’s ways in the Boy Scouts. 7. My great-great-grandmother was a full-blooded whiteAmerican princess. 6. Funny, you don’t look white. 5. Where’s your powdered wig and knickers? 4. Do you live in a covered wagon? 3. What’s the meaning behind the square dance? 2. What’s your feeling about river-boat casinos? Do they really help your people, or are they just a short-term fix? 1. Oh wow, I really love your hair! Can I touch it? 2000 CENSUS 1.5% of U.S. population American Indian or Alaska Native alone Native in combination 40% (26% higher than 1990) 2.5 million (0.9%) In combination with other “races” 1.6 million (0.6%) Total = 4.1 million (1.5%) (110% higher than 1990) Native alone 60% 0 200,000 400,000 600,000 800,000 Cherokee 730 Navajo (Din ) 298 Latin Amer. Indian 181 Choctaw 159 Sioux 153 Chippewa (Ojibwe) Apache Tribe alone (in 1000s) Tribe in combination 149 97 Blackfeet 86 Iroquois 81 Pueblo 74 Tribe not specified 26% Tribe specified 74% Native Population Distribution Northeast 9% Midwest 17% South 31% West 43% 100 million acres = 4% of U.S., BUT….. Modern Indian Lands = 4% of U.S.? 322 entities in Lower 48 = 56 million acres BUT much of rez land is allotted ( non-Indian ownership) Modern Indian Lands = 4% of U.S.? 229 Alaska villages = 44 million acres BUT Alaska Native lands held as village & regional corporations, not as sovereign reservations Federal Recognition of Tribes 1. Historical Written or oral history proves a tribe/nation. 2. Demographical Members not from another tribe. 3. Geographical Lived and continue to live in a distinct area. 4. Political Record of continuous government or leadership. “Trust Responsibility” • Direct relationship between federal & tribal gov’ts • Tribal land put “in trust” to become reservation • Protects reservation from state & local gov’ts • Puts tribe at mercy of federal “trustee” Sovereignty 1. Paramount; supreme 2. Having supreme rank or power 3. Self-governing (American Heritage Dictionary) Percentages by County Reservations 0 5 10 15 19 Alas ka 11.4 Oklahoma 10.5 New Mexico 9 South Dakota 7.4 Montana Arizona 5.7 North Dakota 5.5 Wyoming 20 3 Was hington 2.7 Oregon 2.5 Native percentage, 2000 19 states above U.S. average (1.5%) MN 1.6% WI 1.3% Population by County 0 200 400 600 628 California 392 Oklahoma 293 Arizona 216 Texas 191 New Mexico New York Was hington North Carolina Michigan Alas ka 800 172 159 Native population (in 1000s) 132 124 119 Top 10 states = 62% of Native pop. Urban Population Native alone in NonMetro area 43% Native alone in Metropolitan Area 57% All Natives in NonMetro area 34% All natives in Metropolitan Area 66% 0 5 10 Anchorage, AK 10.4 8 Tulsa, OK 6 Oklahoma City, OK Albuquerque, NM 5 Green Bay, WI 4.1 3.6 Tacoma, WA Minneapolis, MN 3.3 Tucson, AZ 3.2 Spokane, WA Sacramento, CA 15 3 2.5 Native urban percentage, 2000 0 50 100 87 New York, NY 53 Los Angeles, CA 35 Phoenix, AZ 30 Tulsa, OK 29 Oklahoma City, OK 27 Anchorage, AK Albuquerque, NM 22 Chicago, IL 21 San Diego, CA 16 Houston, TX 15 Native urban population (in 1000s) Top 10 cities = 8% of Native pop. xxxxx Canadian Treaties 1,200 tiny reserves today Inuit (Eskimo) territory of Nunavut 1999 Canada
