Grading Criteria
advertisement
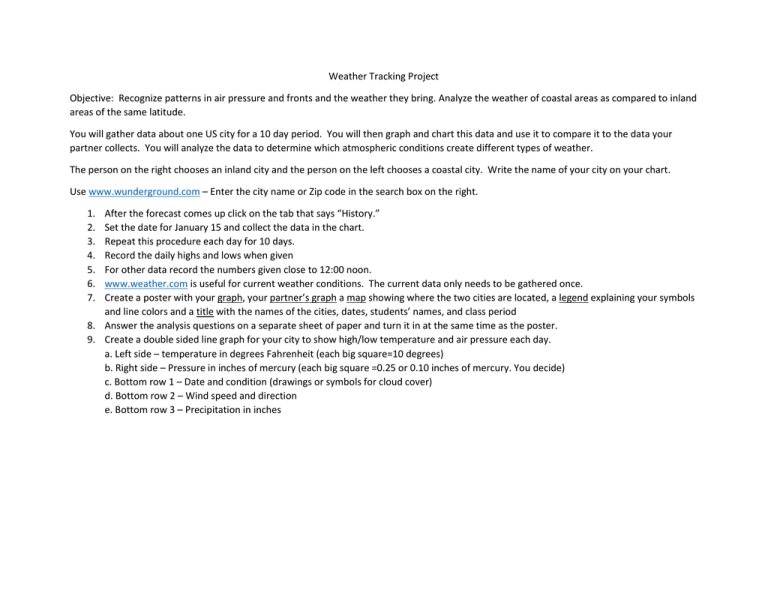
Weather Tracking Project Objective: Recognize patterns in air pressure and fronts and the weather they bring. Analyze the weather of coastal areas as compared to inland areas of the same latitude. You will gather data about one US city for a 10 day period. You will then graph and chart this data and use it to compare it to the data your partner collects. You will analyze the data to determine which atmospheric conditions create different types of weather. The person on the right chooses an inland city and the person on the left chooses a coastal city. Write the name of your city on your chart. Use www.wunderground.com – Enter the city name or Zip code in the search box on the right. 1. 2. 3. 4. 5. 6. 7. After the forecast comes up click on the tab that says “History.” Set the date for January 15 and collect the data in the chart. Repeat this procedure each day for 10 days. Record the daily highs and lows when given For other data record the numbers given close to 12:00 noon. www.weather.com is useful for current weather conditions. The current data only needs to be gathered once. Create a poster with your graph, your partner’s graph a map showing where the two cities are located, a legend explaining your symbols and line colors and a title with the names of the cities, dates, students’ names, and class period 8. Answer the analysis questions on a separate sheet of paper and turn it in at the same time as the poster. 9. Create a double sided line graph for your city to show high/low temperature and air pressure each day. a. Left side – temperature in degrees Fahrenheit (each big square=10 degrees) b. Right side – Pressure in inches of mercury (each big square =0.25 or 0.10 inches of mercury. You decide) c. Bottom row 1 – Date and condition (drawings or symbols for cloud cover) d. Bottom row 2 – Wind speed and direction e. Bottom row 3 – Precipitation in inches Analysis Questions to answer individually on notebook paper or type. 1. Look for days that are clear and sunny on your graph or your partners. What conditions are responsible for this? 2. Look for days that have light rain or snow on your graph or your partners. What conditions are responsible for this? 3. Compare the inland weather to the coastal weather for these two cities. Explain how they differ and why. For example is one usually colder than the other or wetter? 4. Was the general weather pattern over the 10 days the same for both locations? If not, how did it differ? (Was one getting warmer while the other location was getting colder?) 5. What reasons can you offer for these similarities or differences? 6. Did the wind generally come from one direction more than another in each of the two cities? 7. Was there any relationship between the wind and the temperature the next day in each of the two cities? For example, was it colder on days that the wind was coming from one direction and warmer when the wind was coming from a different direction? 8. What kind of precipitation did each city experience? What conditions caused that type of precipitation? 9. How would you describe air pressure changes in each of the two cities? For example, does it seem to be going up, down, or staying the same? 10. Was there any relationship between sky conditions and temperature in each of these cities? For example, was it colder on cloudy days etc.? Grading Criteria Data Gathered for all days and recorded neatly Graphing accurately with all required information Map shows Atlanta and the two cities researched Analysis questions answered accurately and completely Poster Title and students’ names, city names, dates of data collection, and class period all on front of poster Craftsmanship/neatness 20 points possible 30 points possible 10 points possible 30 points possible 5 points possible 5 points possible Draw a weather station model for January 19th here Draw a weather station model for January 24th here
